Time Machine inside a FreeBSD jail
A guide on how to set up Time Machine inside a FreeBSD jail.
Barbara Booth, CNBC:
Civil liberties’ advocates warn that concentrating large volumes of identity data among a small number of verification vendors can create attractive targets for hackers and government demands. Earlier this year, Discord disclosed a data breach that exposed ID images belonging to approximately 70,000 users through a compromised third-party service, highlighting the security risks associated with storing sensitive identity information.
[…]
According to Tandy, as more states adopt age-verification mandates and companies race to comply, the infrastructure behind those systems is likely to become a permanent fixture of online life. Taken together, industry leaders say the rapid spread of age-verification laws may push platforms toward systems that verify age once and reuse that credential across services.
The hurried implementation of age verification sounds fairly terrible, counterproductive, illegal in the U.S., and discriminatory, but we should not pretend that we are only now being subject to risky and overbearing surveillance on the web. The ecosystem powering behavioural ad targeting — including data brokers, the biggest of which have reported staggering data breaches for a decade — has all but ensured our behaviour on popular websites and in mobile apps is already tracked and tied to some proxy for our identity.
That is not an excuse for the poor implementation of age verification, nor justification for its existence. If anything, it is a condemnation of the current state of the web that this barely moves the needle on privacy. If I had to choose whether to compromise for commerce or for the children, it would be the latter, but the correct answer is, likely, neither.
Casey Newton, Platformer:
On Friday I learned to my surprise that I had become an editor for Grammarly. The subscription-based writing assistant has introduced a feature named “expert review” that, in the company’s words, “is designed to take your writing to the next level — with insights from leading professionals, authors, and subject-matter experts.”
Read a little further, though, and you’ll learn that these “insights” are not actually “from” leading professionals, or any human person at all. Rather, they are AI-generated text, which may or may not reflect whichever “leading professional” Grammarly slapped their names on.
Miles Klee, Wired:
As advertised on a support page, Grammarly users can solicit tips from virtual versions of living writers and scholars such as Stephen King and Neil deGrasse Tyson (neither of whom responded to a request for comment) as well as the deceased, like the editor William Zinsser and astronomer Carl Sagan. Presumably, these different AI agents are trained on the oeuvres of the people they are meant to imitate, though the legality of this content-harvesting remains murky at best, and the subject of many, many copyright lawsuits.
I do not think a disclaimer explaining it does “not indicate any affiliation with Grammarly or endorsement by those individuals or entities” will sufficiently distance the company from its claim of providing “insights from leading professionals, authors, and subject-matter experts” attributed to the names of people who did not agree to participate in this. Apparently, it is incumbent upon them to opt out by emailing expertoptout@superhuman.com. Most people will obviously not do this — because why would anyone realize they need to opt out? — but especially those who are dead yet are still being called upon for their expertise. Let Carl Sagan rest.
Charlie Sorrel, of iFixit:
Apple’s MacBooks haven’t always been monolithic, barely repairable slabs of aluminum, glass, and glue. They used to be almost delightful in their repairable features, from their batteries to their Wi-Fi cards. Powerbooks, iBooks, and especially early MacBooks showed what happens when Apple applies its design skills directly to repairability and maintenance, instead of to thinness above all. Today we’re going to take a look at the best repairability features that Apple has ditched.
These four complaints range from the somewhat quaint — swappable Wi-Fi cards — to the stuff I actually miss, which is everything else. RAM and disk upgrades are a gimme since the cost-per-gigabyte (generally) declines over time, and I would love easily swappable batteries. But right now, nearly four years into owning this MacBook Pro, I would also really like to be able to swap in a new keyboard in the future. Not only are the keycaps unintentionally becoming polished, some oft-used keys feel a little mushy. Not much, and barely enough to notice, but I imagine their clickiness will not improve over time.
One quibble, emphasis mine:
[…] I have an old 2012 MacBook Air running Linux. I swapped the HDD for an SSD, maxed out the RAM, and dropped in a new battery, and I see no reason it wouldn’t easily keep rolling for another 10 years.
Unlikely. The 2012 MacBook Air only came with an SSD; a standard hard disk was not an option.
Juli Clover, MacRumors:
Apple renamed the prior Reduce Highlighting Effects Accessibility setting to “Reduce Bright Effects,” and explained what it does.
Apple says the feature “minimizes highlighting and flashing when interacting with onscreen elements, such as buttons or the keyboard.
In my testing, this does exactly what you would expect. In places like toolbar buttons — or the buttons in the area of what is left of a toolbar, anyhow — the passcode entry screen, and Control Centre, the glowing tap effects are minimized or removed.
I do not find those effects particularly distracting, and I think turning them off saps some of the life out of the Liquid Glass design language, but I can see why some would be bothered by them. It is not the case that iOS 26 would be better if none of these appearance controls were present, only that they should not be necessary.
There are three agreed-upon policies which, in the airy language of a government press release, seem reasonable enough to apply to all social platforms, yet are only relevant to TikTok. The first is exceedingly vague:
TikTok will implement enhanced protection for Canadians’ personal information, including new security gateways and privacy-enhancing technologies to control access to Canadian user data in order to reduce the risk of unauthorized or prohibited access.
There are no details about what the “new security gateways and privacy-enhancing technologies” are, nor why the sole goal is preventing “prohibited access” rather than “exploitative access”.
The second — complying with the recommendations of the Privacy Commissioner — was already underway, and the third is an “independent third-party monitor”, which seems fine.
Do you want an all-in-one solution to block ads, trackers, and annoyances across all your Apple devices?
Then download Magic Lasso Adblock — the ad blocker designed for you.

With Magic Lasso Adblock you can effortlessly block ads on your iPhone, iPad, Mac, and Apple TV.
Magic Lasso is a single, native app that includes everything you need:
Safari Ad Blocking — Browse 2.0× faster in Safari by blocking all ads, with no annoying distractions or pop ups
YouTube Ad Blocking — Block all YouTube ads in Safari, including all video ads, banner ads, search ads, plus many more
App Ad Blocking — Block ads and trackers across the news, social media, and game apps on your device, including other browsers such as Chrome and Firefox
Apple TV Ad Blocking — Watch your favourite TV shows with less interruptions and protect your privacy from in-app ad tracking with Magic Lasso on your Apple TV
Best of all, with Magic Lasso Adblock, all ad blocking is done directly on your device, using a fast, efficient Swift-based architecture that follows our strict zero data collection policy.
With over 5,000 five star reviews, it’s simply the best ad blocker for your iPhone, iPad, Mac, and Apple TV.
And unlike some other ad blockers, Magic Lasso Adblock respects your privacy, doesn’t accept payment from advertisers, and is 100% supported by its community of users.
So, ensure your browsing history, app usage, and viewing habits stay private with Magic Lasso Adblock.
Join over 400,000 users and download Magic Lasso Adblock today.
Nilay Patel and Liz Lopatto discussed “prediction markets” on the Verge’s “Decoder” podcast; here is Patel’s summary:
Insider trading is supposed to be illegal, and so is operating an unregulated sports book. So you’re now starting to see Kalshi and Polymarket getting hit from both sides of this broader regulatory debate, and 2026 is shaping up to be the year that all of this really comes to a head. To what end? It’s hard to say, especially as these companies cozy up to the Trump administration.
But it’s also becoming increasingly untenable for prediction markets to sit in the middle of the tension between gambling on the news and trying to self-regulate such that they don’t encourage insider trading.
A little under a month after Gallup announced it would stop polling for presidential approval, the Associated Press said it would begin integrating Kalshi bets into its election coverage. As Patel and Lopatto say, however, election betting is among the least problematic news gambling.
Charlie Warzel, the Atlantic (gift link):
Prediction markets claim to harness the wisdom of crowds to provide reliable public data: Because people are putting real money behind their opinions, they are expressing what they actually believe is most likely to happen, which, according to the reasoning of these platforms, means that events will unfold accordingly. Many news organizations, and Substack, now have partnerships with prediction markets — the subtext being that they provide some kind of news-gathering function. Some users who distrust mainstream media turn to the markets in place of traditional journalism.
But in reality, prediction markets produce the opposite of accurate, unbiased information. They encourage anyone with an informational edge to use their knowledge for personal financial gain. In this way, prediction markets are the perfect technology for a low-trust society, simultaneously exploiting and reifying an environment in which believing the motives behind any person or action becomes harder.
I had no idea so-called “prediction markets” like Kalshi and Polymarket were promoting themselves as forecasters of real information, let alone that anyone believed them. I always assumed “prediction markets” was a euphemism.
A spokesperson for Kalshi told Warzel that betting on current events is a way to “create accurate, unbiased forecasts”, and that is something we can verify. If this were true, bettors should have been able to forecast, for example, the popular vote split of the 2024 U.S. presidential election. Polls had Harris and Trump neck and neck, but on election day, 75.8% of Kalshi bettors believed Harris would prevail. There is not much granularity to Kalshi’s charts, but the forecast on Polymarket was favourable to Harris at 5:00 PM on November 5 — election day — and it flips to a Trump lead at the next available data point, 5:00 AM the following day, and well after it was obvious Trump won the popular vote.
This is just a way to gamble on current events, which is tragic and pathetic. We do not need to pretend these sites are anything more substantial than that.
Sameer Samat, Google’s president of Android Ecosystem:
Today we are announcing substantial updates that evolve our business model and build on our long history of openness globally. We’re doing that in three ways: more billing options, a program for registered app stores, and lower fees and new programs for developers.
Epic Games CEO Tim Sweeney on X:
Google is opening up Android all the way with robust support for competing stores, competing payments, and a better deal for all developers. So, we’ve settled all of our disputes worldwide. THANKS GOOGLE!
Simon Sharwood, the Register:
Epic Games approved of the changes.
“These changes will evolve Android into a true open platform with competition among stores,” the company stated. “Globally, developers will have choices in how they make payments using Google Play’s payment system and competing payment systems, with reduced fees and the ability to point users outside apps to make purchases.
Epic also said “Google will take steps to support the future open metaverse,” a probable reference to the deal that will see games made with the Unity engine made available within Fortnite.
Neither Sweeney nor Epic Games can express anything less than elation with this outcome in no small part because they signed away their ability to do that. It still amazes me that concession ended up in the final agreement. It seems like the kind of thing that Google’s very expensive lawyers would pitch as leverage with Epic Games’ not-quite-as-expensive lawyers. In an interview with Dean Takahashi, of GamesBeat, it seems like Epic was eager to settle with terms that apply worldwide:
Asked why Sweeney decided to settle rather than litigate in every court in the world, he said, “This is just a really important thing that people should understand. The Epic versus Google court decision in the United States only has effect in the United States. It does nothing about the rest of the world. And the United States is about 30% of Google Play revenue and about 5% of Google Play users.”
He said it was never going to be a complete worldwide solution, and the court, throughout the proceedings, very clearly, said that the court wanted to establish competition among stores and competition among payments without setting prices in the market.
Curiously, not long before this settlement, Google announced it would begin requiring Android developers to be verified for their software to be installable, even by side-loading. I am curious if the combination of these changes meaningfully impacts users’ security or privacy. At a glance, the changes that settled this lawsuit seem like a welcome set of improvements that, sure, was assuredly not an altruistic fight by Epic Games, and will probably result in Sweeney getting even richer.
Regardless, it is notable for these sweeping changes to be brought to Android phones worldwide in the coming years, while Apple’s App Store is a patchwork of region-specific policies difficult for developers to navigate. It is too bad there is not really competition between these stores. Most people who buy smartphones choose the platform as a whole and accept whatever software experience they are provided. They do not need to bother themselves with the business terms of each store. With the improvements to third-party stores on Android, it sets up the possibility for greater competition within that platform. Apple should do the same.
In hardware terms alone, Apple has been delivering an incredible run of Macs arguably since 2020, and easily since 2021. There are quibbles, sure — the display notch still bugs some people, the keyboard material wears poorly, and repairability has declined — but these are, overall, pretty sweet machines. The Macs announced this week seem like they will continue that hot streak.
I happen to be in the market for a new Mac, perhaps this year, and I should be spoiled for choice. I kind of am — the Mac Mini and Mac Studio are both alluring. But I am sadly attached to the room offered by my beloved 27-inch iMac, and Apple’s new lineup of displays is a sore point.
Stephen Hackett, 512 Pixels:
Yes, those are two different products, but they both feature 27-inch, 5K displays in the same enclosure as the previous Studio Display.
Starting at $1599, the new Studio Display is a slight upgrade to the 2022 model.
[…]
The much more interesting of the pair is the $3299 Studio Display XDR.
Those prices are, respectively, $2,100 and $4,500 in Canada. I am not a stranger to spending a lot of money on a screen — I bought a Thunderbolt Display at $1,000 — but that is a lot of money for even the basest of base models, especially since I have no idea whether the sketchy firmware issues have been resolved.
It is not that these displays are bad — far from it — but it is extraordinary that we are ten years removed from 27-inch Retina iMacs that started at just $200 more than the Studio Display is today. Only recently are we seeing more choice in 27-inch 5K displays at considerably lower prices, though without Apple’s very nice stand and quality of materials. At least the XDR has a seemingly new panel.
Three of the seven models in the Mac lineup require an external display. Apple has two choices: one really advanced one that costs as much as a generously-specced Mac Studio, and another that feels like it is stumbling along.
Anyway, here I go again looking for a sick deal I will not find on a Pro Display XDR. Those things really hold their value. Pity.
Sean Hollister, the Verge:
But Google has finally muzzled Tim Sweeney. It’s right there in a binding term sheet for his settlement with Google.
On March 3rd, he not only signed away Epic’s rights to sue and disparage the company, he signed away his right to advocate for any further changes to Google’s app store polices. He can’t criticize Google’s app store practices. In fact, he has to praise them.
The terms (PDF) helpfully clarify that Epic is still allowed to “advocat[e] changes to the policies or practices of […] other companies, including Apple”. This does not mean future criticism of Apple’s business practices — or past criticism, for that matter — is unwarranted or invalid, but it now carries the blunted quality of someone who is not allowed to make the same complaints about Google.
Google’s Threat Intelligence Group:
Google Threat Intelligence Group (GTIG) has identified a new and powerful exploit kit targeting Apple iPhone models running iOS version 13.0 (released in September 2019) up to version 17.2.1 (released in December 2023). The exploit kit, named “Coruna” by its developers, contained five full iOS exploit chains and a total of 23 exploits. The core technical value of this exploit kit lies in its comprehensive collection of iOS exploits, with the most advanced ones using non-public exploitation techniques and mitigation bypasses.
The Coruna exploit kit provides another example of how sophisticated capabilities proliferate. Over the course of 2025, GTIG tracked its use in highly targeted operations initially conducted by a customer of a surveillance vendor, then observed its deployment in watering hole attacks targeting Ukrainian users by UNC6353, a suspected Russian espionage group. We then retrieved the complete exploit kit when it was later used in broad-scale campaigns by UNC6691, a financially motivated threat actor operating from China. […]
Andy Greenberg, Wired:
Conspicuously absent from Google’s report is any mention of who the original surveillance company “customer” that deployed Coruna may have been. But the mobile security company iVerify, which also analyzed a version of Coruna it obtained from one of the infected Chinese sites, suggests the code may well have started life as a hacking kit built for or purchased by the US government. Google and iVerify both note that Coruna contains multiple components previously used in a hacking operation known as “Triangulation” that was discovered targeting Russian cybersecurity firm Kaspersky in 2023, which the Russian government claimed was the work of the NSA. (The US government didn’t respond to Russia’s claim.)
I am so curious to know how this thing made it outside the carefully guarded digital walls of the U.S. government or a contractor. While a rare event, it is not the first time the classified weapons of espionage have become public.
Joseph Cox, 404 Media:
Customs and Border Protection (CBP) bought data from the online advertising ecosystem to track peoples’ precise movements over time, in a process that often involves siphoning data from ordinary apps like video games, dating services, and fitness trackers, according to an internal Department of Homeland Security (DHS) document obtained by 404 Media.
[…]
Although CBP described the move as a pilot, the DHS Office of the Inspector General (OIG) later found both CBP and ICE did not limit themselves to non-operational use. The OIG found that CBP, ICE, and the Secret Service all illegally used the smartphone location data, and found a CBP official used the data to track coworkers with no investigative purpose. CBP and ICE went on to repeatedly purchase access to location data.
There are people out there who will insist, to this day, that behaviourally targeted advertising is not actually a mechanism for surveillance despite all the evidence showing it is, in fact, an essential component.
Naipanoi Lepapa, Ahmed Abdigadir, and Julia Lindblom, Svenska Dagbladet:
The workers in Kenya say that it feels uncomfortable to go to work. They tell us about deeply private video clips, which appear to come straight out of Western homes, from people who use the glasses in their everyday lives.
Several describe video material showing bathroom visits, sex and other intimate moments.
Another worker talks about people coming out of bathrooms.
It is appalling that massively rich corporations like Meta continue to offload critical tasks like these onto people who receive little support or pay. I recently finished “Ghost Work” by Mary L. Gray and Siddharth Suri and, while not my favourite book nor surfacing anything conceptually new, is worth your time. Meta can and should be doing far better, but can avoid association with labour atrocities better than, say, Nike in the 1990s in part because I doubt most people think too much about human intervention in artificial intelligence. Meta does not celebrate the hard work of its contract labour in Kenya; it does not even acknowledge them.
Speaking of not acknowledging the human labour involved, this story is the obvious nightmare you would expect. Some of these incidents of sensitive video recordings appear to be accidental, while others are seemingly deliberate. Without excusing the people who seem to be recording creepy videos on purpose, I assume few people would have believed it would be seen by someone at a company they probably have not heard about.
At first glance, it appears that we have significant control over our data. It states that voice recordings may only be saved and used for improvement or training of other Meta products if the user actively agrees.
But for the AI assistant to function, voice, text, image and sometimes video must be processed and may be shared onwards. This data processing is done automatically and cannot be turned off.
This is the kind of thing I would expect would be bundled into the additional diagnostic information Meta asks if you would like to opt into sharing. But Meta says this “does not include the photos and videos captured by your glasses”. That is, as this investigation found, part of the mandatory data collection.
This is offensive on behalf of users who might be less likely to consent if they had this full information. But it is also offensive to their romantic partners, friends, acquaintances, and passers-by, none of whom agreed to have their image or conversations adjudicated by these contractors.
In a WWDC 2011 session, Dan Schimpf explained some of the goals of the refreshed design for Aqua in Mac OS X Lion were “meant to focus the user attention on the active window content”. This sentiment was echoed by John Siracusa in his review of Lion for Ars Technica:
Apple says that its goal with the Lion user interface was to highlight content by de-emphasizing the surrounding user interface elements.
When Apple redesigned Mac OS X again in 2014 with Yosemite, it promised…
[…] a fresh modern look where controls are clearer, smarter and easier to understand, and streamlined toolbars put the focus on your content without compromising functionality.
Then, when it revealed the Big Sur redesign in 2020, it explained:
The entire experience feels more focused, fresh, and familiar, reducing visual complexity and bringing users’ content front and centre.
And you will never guess what it promised in 2025 with the announcement of MacOS Tahoe and Liquid Glass, as introduced by Alan Dye:
Our goal is a beautiful new design that brings joy and delight to every user experience. One that’s more personal, and puts greater focus on your content — all while still feeling instantly familiar.
It is not just Apple, either. Here is Microsoft’s Jensen Harris at Build 2011 describing a key goal for the company’s then-new Metro design language:
Metro-style apps have room to breathe. They’re not about the chrome, they’re about the content. […] For years, Windows was always about adding stuff. We added bars, and panes, and doodads, and widgets, and gadgets, and bars — and stuff everywhere. And that’s how we defined our U.I., based on what new widgets we added. Now, we’ve receded into the background, and the app is sitting out there on the stage.
And later, as Microsoft rolled out app updates with its Fluent Design language, it described them in familiar terms:
With the updated OneDrive, your content takes center stage. The improved visual design reduces clutter and distractions, allowing you to focus on what’s important – your content.
This is a laudable goal if the opposite is, I assume, increasing the amount of clutter in user interfaces and making them more distracting. Nobody wants that. Then again, while the objective may be quite reasonable, there are surely different ways of achieving it — but Apple has embraced a single strategy: make the interface blend into the document. (I will be focusing on MacOS here as it is the platform I am most familiar with.)
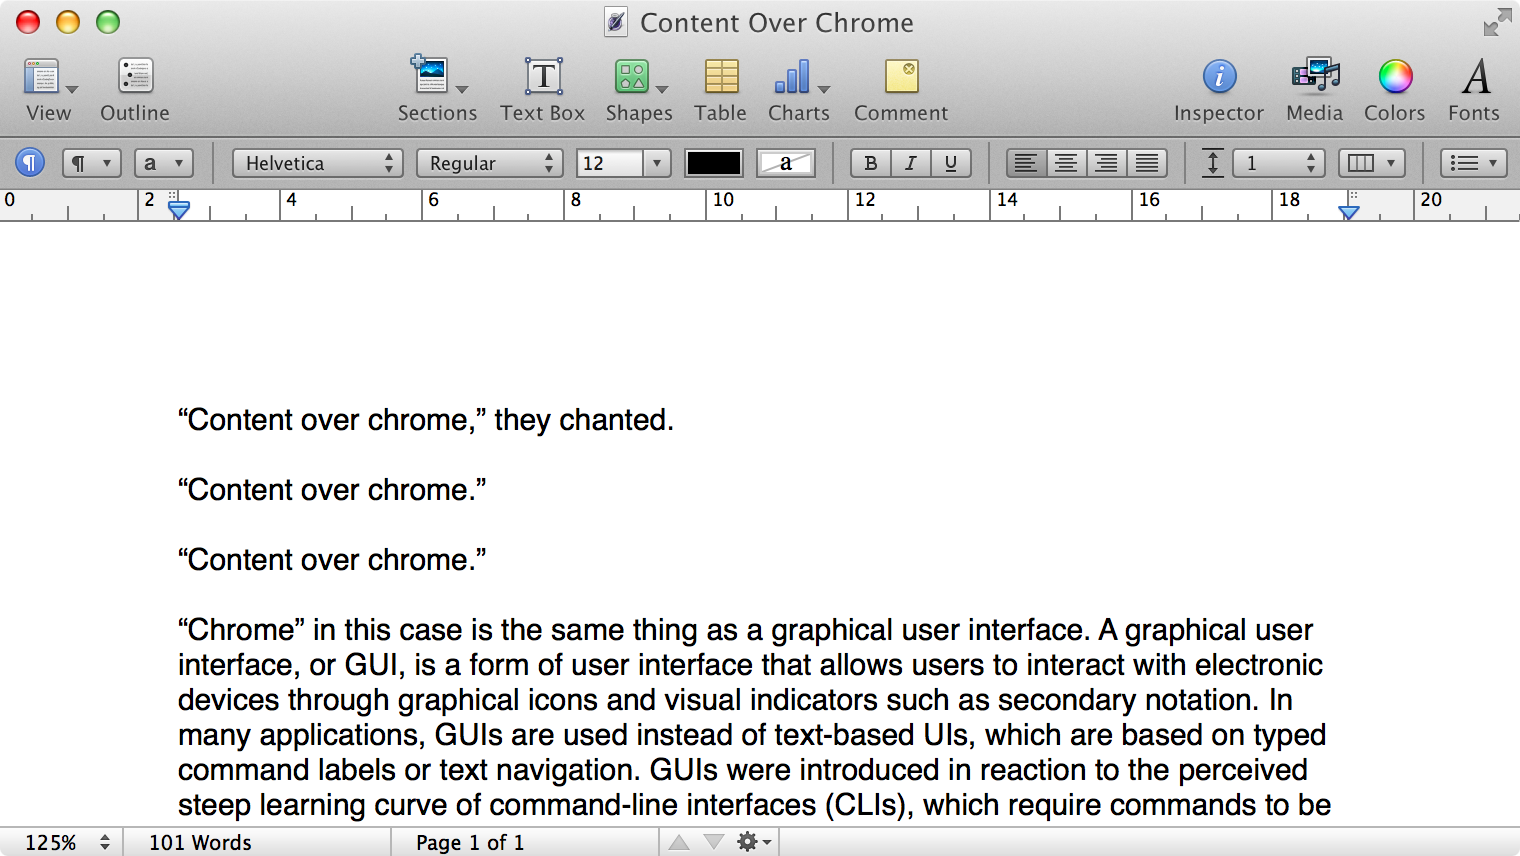
Here is what a Pages document looks like running under Mac OS X Lion:
Here is that same document in a newer version of Pages running on MacOS Catalina, with the Yosemite-era design language that replaced the one that came before:
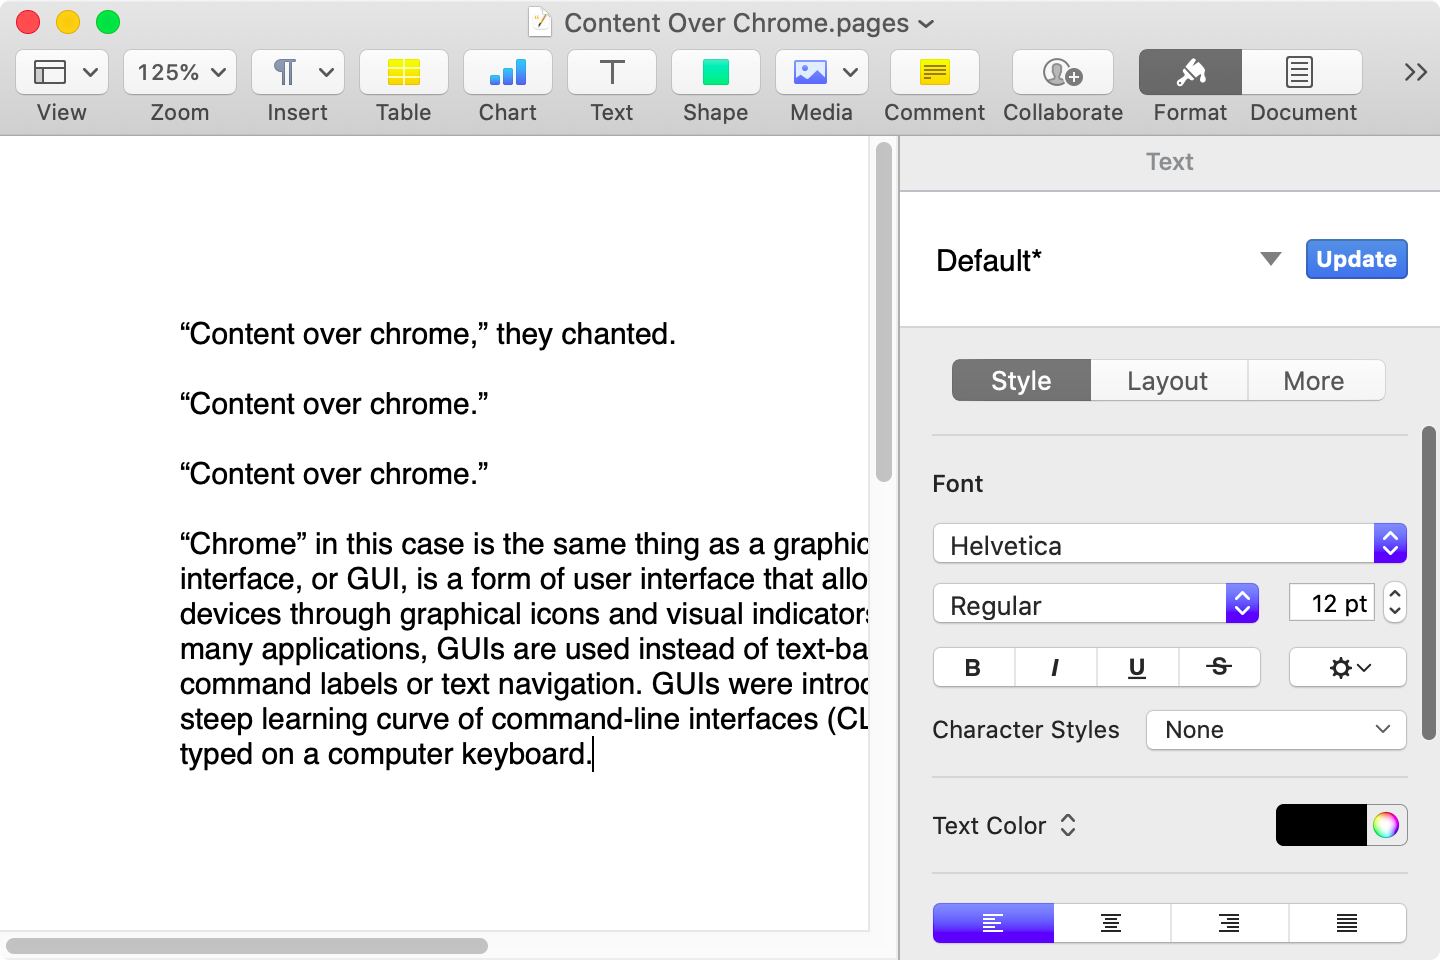
Here it is in the last version of Pages on MacOS Tahoe, using the design language introduced with Big Sur:
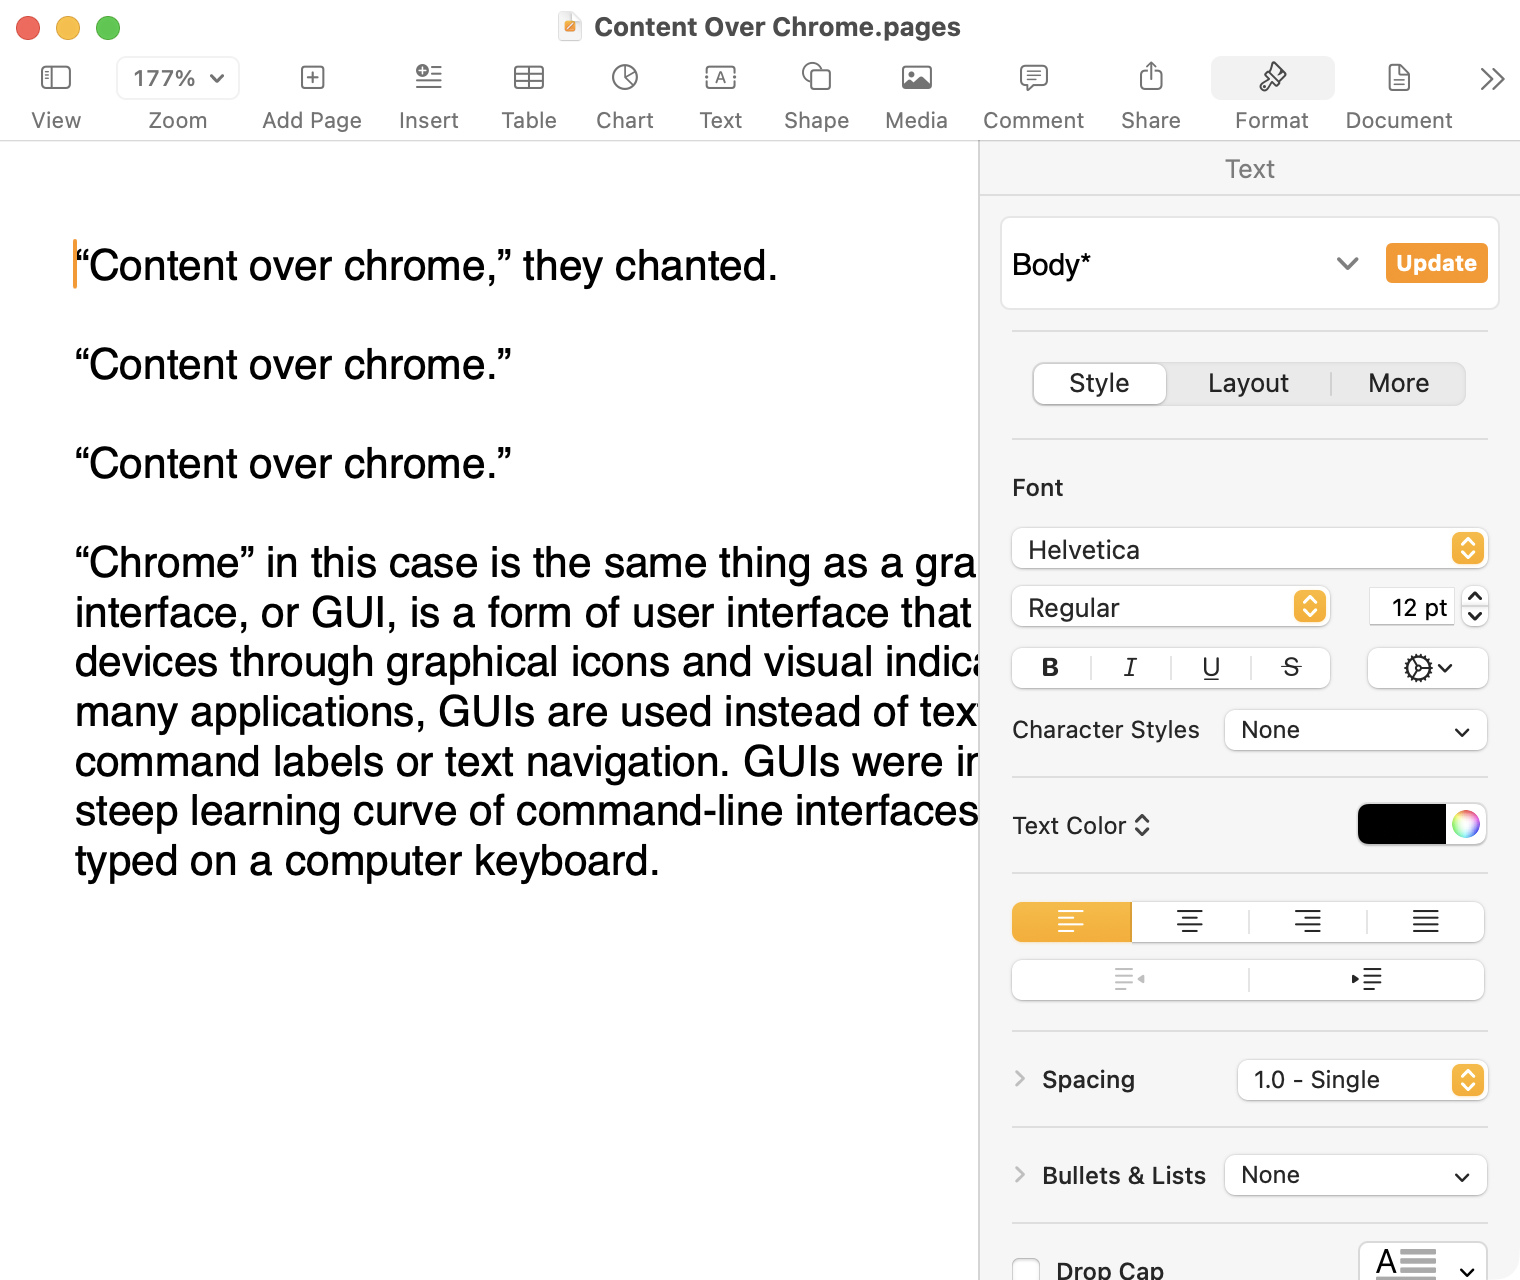
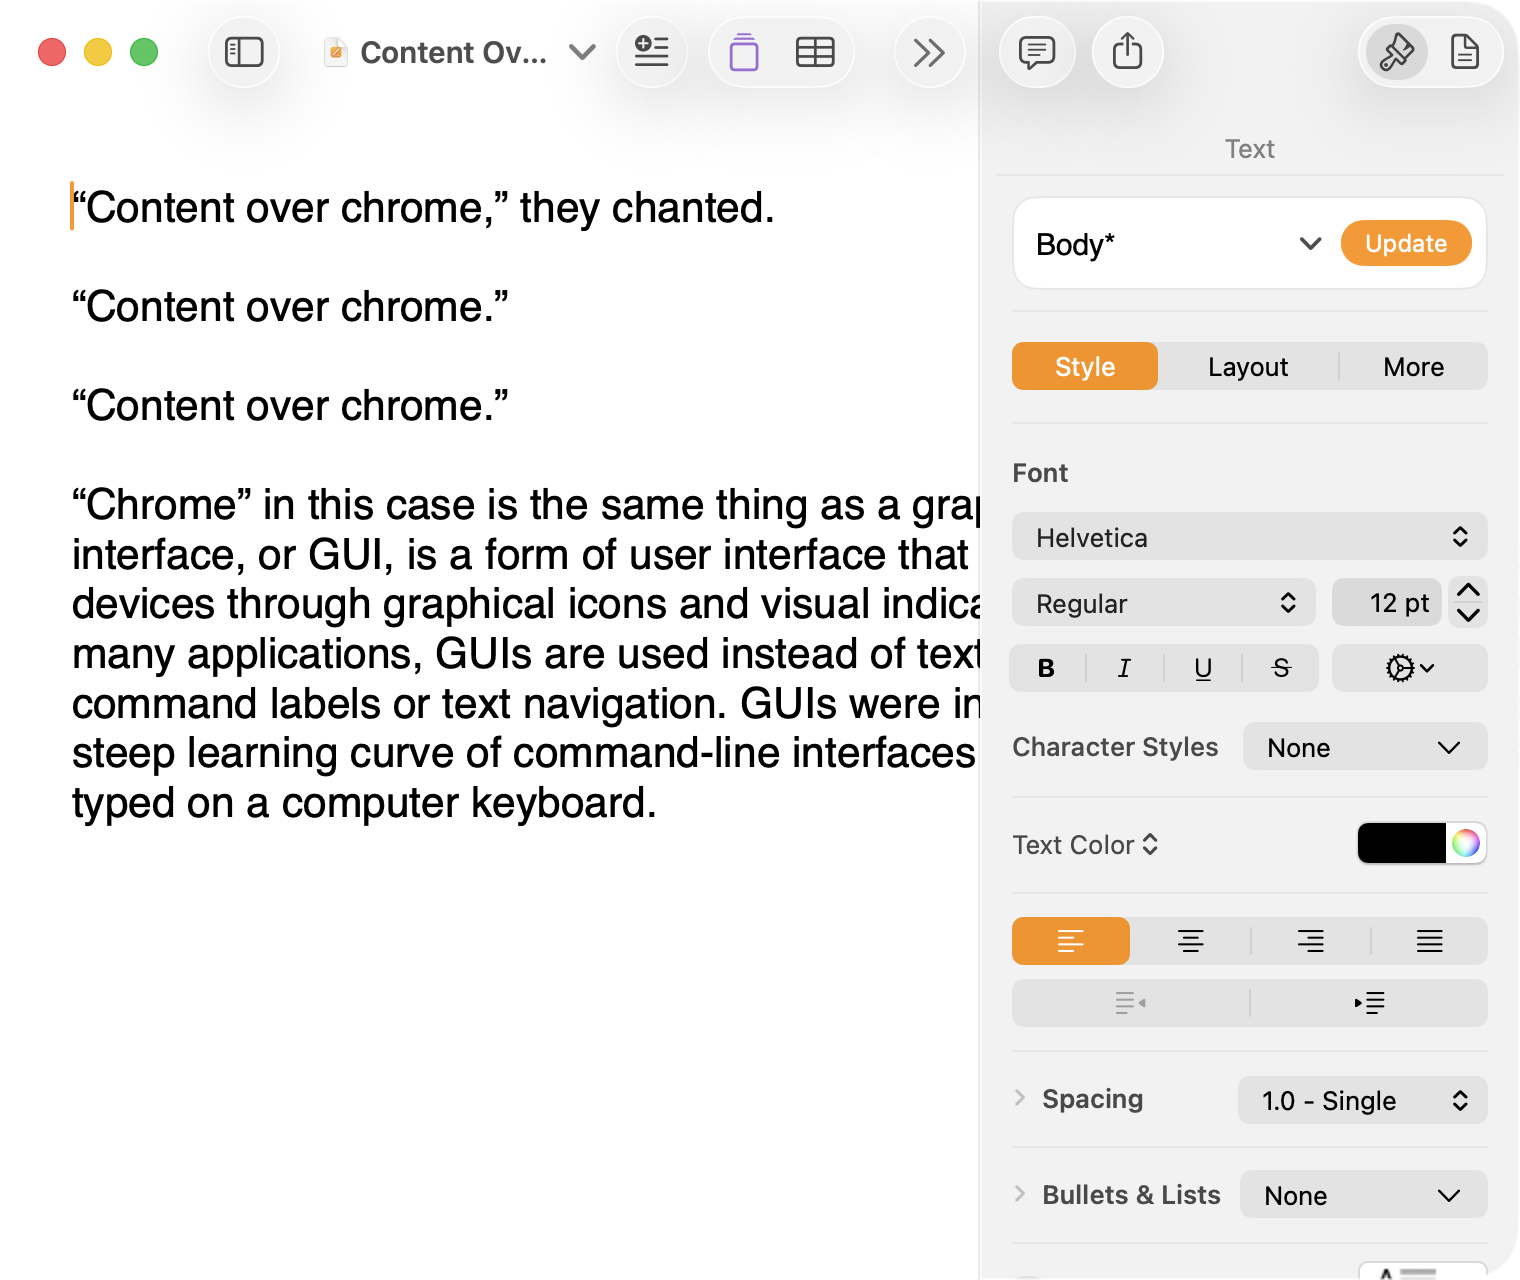
And, finally, the newest version of Pages on MacOS Tahoe using the current Liquid Glass visual design language:
There are welcome improvements in newer versions of this comparison, like the introduction of the “Format” panel on the right-hand side, which makes better use of widescreen landscape-oriented displays, and allows for larger controls. While I admire the density of the Lion-era screenshot, the mini-sized controls in that formatting menu are harder to click.1
Overall, however, what Apple has done to Pages over this period of time is representative of a broader trend of minimizing the delineation of user interface elements from each other and the document itself. This is the only tool in the toolbox, and I am skeptical it achieves what Apple intends.
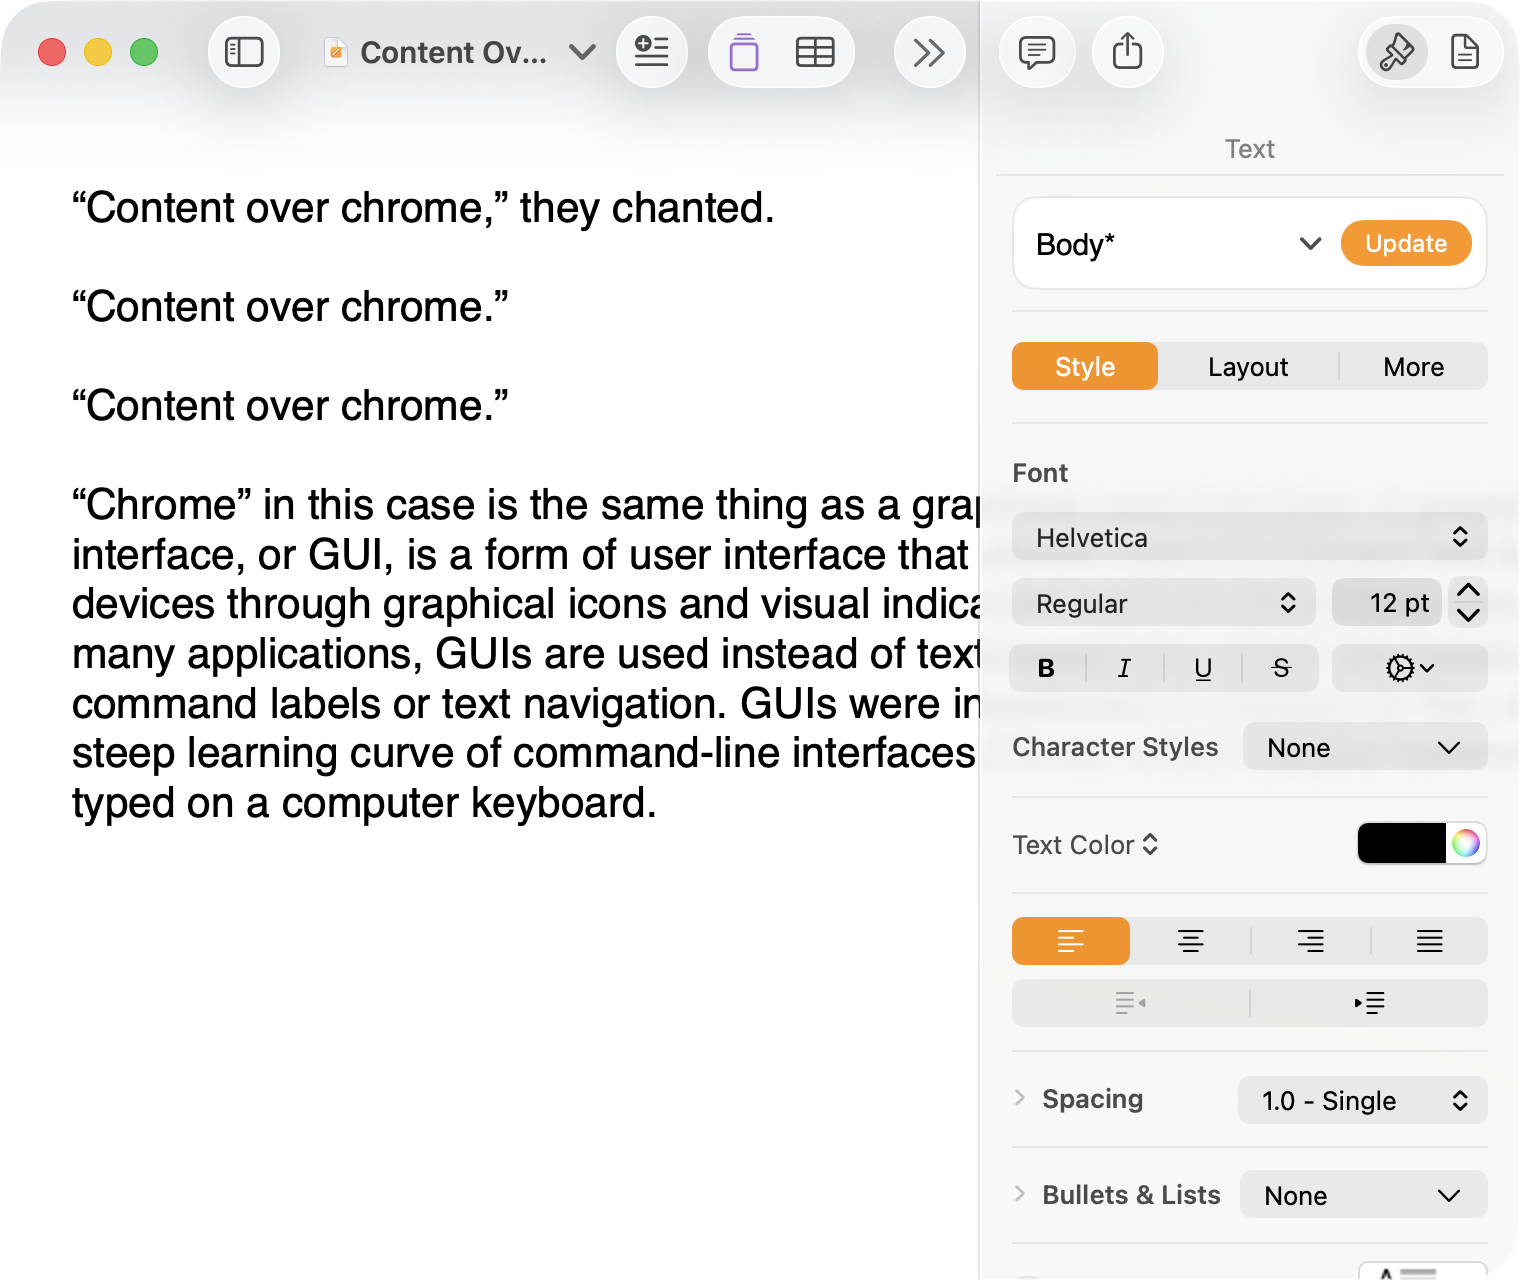
Compare again the two more recent screenshots against the ones that came before, and focus on the toolbar at the top of each. In the older two, there is a well-defined separation between the toolbar — the window itself — and the document. In the Big Sur visual language, however, the toolbar is the same bright white as the document. By Tahoe and the Liquid Glass language, there is barely a distinction; the buttons simply float over the document. And, bizarrely, that degrades further with the “Reduce Transparency” accessibility preference enabled:
(Also, no, your eyes do not deceive you: the icons in the drop cap menu, barely visible in the lower-right, are indeed pixellated.)
For me, this means a constant distraction from my document because the whole window has a similar visual language. As the toolbar and its buttons become one with the document, they lose their ability to fade into the background. In the two older examples, the contrast of the well-defined toolbar allows me to treat them as an entirely separate thing I do not need to pay attention to.
This is further justified by the lower contrast within those two older toolbars. In Lion, the grey background and moderately saturated colours are a quiet reminder of tools that are available without them being intrusive. The mix of shapes is a sufficient differentiator, something Apple threw away in the following screenshot. By making all the buttons literal and with the same bright background, the toolbar becomes a little more distracting — but at least it does not blend into the document. Without the context of the previous screenshot, the colours of each icon seem almost random, and I find the yellow-on-white “Table” button difficult to distinguish at a glance from the black-on-yellow-on-white “Comment” button.
The Big Sur-era design language is, frankly, an atrocious regression. The heterogeneous shapes may have returned, but in the form of monochromatic medium-grey icons set against a uniform white background. The icons are not bad, per se — though putting “Add Page” and “Insert” next to each other in this default toolbar layout, both represented by a plus sign, is a little confusing. But I will bet you would not guess that some of these are buttons, while others are pop-up buttons with a submenu.
Finally, there is Liquid Glass which, in its default form, has more contrast than the previous example; with “Reduce Transparency” enabled, which is how I use MacOS, it has even less. The buttons themselves have a greater amount of internal contrast with bigger, darker grey icons on a white background. This is preferential within the context of the toolbar compared to the thin, small, and low-contrast buttons in the past example, but it also means this toolbar has similar contrast to the document itself.
I would not go so far as to argue that Pages ’09 has a perfect user interface and that everything since has been a regression. The average colours used for the icon fill in both older toolbars generally fails accessibility contrast checks which, remarkably, the Big Sur design will pass. The icons in Pages ’09 rely on dark outlines and unique shapes to have sufficient contrast with the toolbar background. However, Apple has since discarded most variables it could change to design these interfaces. Every button contains an icon of a single uniform colour, within barely defined holding containers of the same shape, and without text labels by default.
This monochromatic look means any splash of colour is distracting. The yellow accent used in Pages is garish — though, thankfully, something that can mostly be mitigated by changing the Theme Colour in System Settings, under Appearance. (Unfortunately, the yellow background remains on the “Update” button in the most recent version of Pages regardless of the system accent colour.) But perhaps you also noticed the purple icon in the Liquid Glass screenshot above. Here is the full toolbar:

Those purple icons signify features that are part of Apple Creator Studio, a paid subscription to Pages and other applications that allows you to — in the order they are presented above — generate an image, artificially boost the resolution of an image, and access a stock image library. If you would like to insert one of your own images into your Pages document, that feature has been moved to the paperclip icon. Yes, it is a menu and not a button, despite lacking the disclosure triangle of the zoom menu right beside it, and it also reminds you about the “Content Hub” and “Generate Image” features. In Pages under Lion, colour was used in the icons to help guide the user as they complete a task — click the green thing to add a shape; click the darker yellow thing to add a table. Colour is not being used in the newer version to signify these are A.I. features, as the “Writing Tools” icon remains dark grey. In this version, the coloured icons are there to guide the user to premium add-ons regardless of whether they are currently paying for them.
I decided to focus on Pages for this comparison because it has lived so many different lives in MacOS. However, it is perhaps an imperfect representation for the rest of the system. Across Mac OS X Lion, for example, the toolbars of first-party applications like Finder and Preview almost exclusively use monochromatic icons. This has been true since Mac OS X Leopard, which also introduced barely differentiated folder icons. Some toolbars in Tiger, introduced two years prior, featured icons inside uniform capsule shapes. These were questionable ideas at the time, but they still retained defining characteristics. The capsules, for example, may have had a uniform shape, but contained within were full-colour icons. Most importantly, they were all clearly controls that were differentiated from the document.
Perhaps Apple has some user studies that suggest otherwise, but I cannot see how dialling back the lines between interface and document is supposed to be beneficial for the user. It does not, in my use, result in less distraction while I am working in these apps. In fact, it often does the opposite. I do not think the prescription is rolling back to a decade-old design language. However, I think Apple should consider exploring the wealth of variables it can change to differentiate tools within toolbars, and to more clearly delineate window chrome from document.
These screenshots are a bit limited as, to capture a high-resolution interface, I switched my mid-2012 MacBook Air to a 720 × 450 display output, which shrank the available space for Pages in the Lion and Catalina screenshots. ↥︎
I have a document open in BBEdit right now named “2025-06-22 – MacOS SaaS.markdown”. I started drafting this thing last year about how Apple has transitioned its operating systems to something closer to a software-as-a-service model. I was trying to describe how the difference between major versions has become generally more modest since many features are rolled out across the year, and how — particularly on Apple’s non-Mac platforms — updates are more-or-less forced since the company stops digitally certifying older versions.
It is not a perfect comparison and not quite a fully-developed idea — note the difference between the filename and the last sentence above — but I thought it was going somewhere. Of course, you had no idea about this because I never published, which is why it must have seemed strange when I dropped a reference to software-as-a-service in the middle of my piece about software quality:
There was a time when remaining on an older major version of an operating system or some piece of software meant you traded the excitement of new features for the predictability of stability. That trade-off no longer exists; software-as-a-service means an older version is just old, not necessarily more reliable.
Riccardo Mori was understandably confused by this:
[…] I very much enjoy using older Mac OS versions, but not being able to browse the Web properly and securely, not being able to correctly sign in to check a Gmail account, not being able to fetch some RSS feeds because you can’t authenticate securely or establish a secure connection is very frustrating. Not having Dropbox work on my 2009 MacBook Pro running OS X 10.11 El Capitan is a minor annoyance and means I just won’t have access to certain personal files and that I’ll have to sync manually whatever I do on this other machine.
But if I put these two factors aside, there’s nothing about those older Macs, nothing about the older Mac OS versions they run that makes them less reliable. […]
What Mori explains as this paragraph continues is what I had meant to write at the time. What I should have written was this (emphasis mine):
There was a time when remaining on an older major version of an operating system or some piece of software meant you traded the excitement of new features for the predictability of stability. That trade-off no longer exists; an operating system on a software-as-a-service treadmill means an older version is just old, not necessarily more reliable.
The cycle of having a major new version ready to preview by June and shipping in September means the amount of time Apple spends focusing on the current version must necessarily shrink. How many teams at the company do you suppose are, right now, working on MacOS 26 when WWDC is a little over three months away? Engineering efforts are undoubtably beginning to prioritize MacOS 27. There are new features to prepare, after all.
So, yes, what Mori writes is what I was trying to express. I wish I had given that sentence a little more thought. Do read Mori’s piece — the second part, “On Software Frugality”, is thought-provoking.
Jon Hicks, last year:
Music apps leave me wanting.
While I collect albums both physically (Vinyl + CD) and digitally (from Bandcamp), there are still missing pieces that streaming services provide: discovering new music, sharing playlists and seeing what friends are playing so that I can try their recommendations. They’re a valuable part of my listening habits, but none of them feel like ‘the one’. […]
I only stumbled across this today, but it remains a wonderful encapsulation of the state of music apps today. I share Hicks’ criteria, though I would add three things for myself:
More expansive metadata. I would like genres that work more like tags. An artist may generally make records in one genre, but different albums have different influences. Even individual songs may considerably differ in sound and style. This is the kind of thing that would help me make playlists or find songs that sound better together.
This would be a management challenge across the tens of thousands of songs in my library, but I feel like integration with RateYourMusic and other databases might help partially automate this.
iPhone syncing over a wire. One of Hicks’ criteria is streaming and local library in the same app, and I completely agree. But I do not want anything — especially iPhone syncing — to be predicated on an assumption I have Apple’s first-party iCloud Music stuff turned on.
No lock-in. I want to be able to point it at my existing library and for things to just work. I would like to be able to import my entire setup from Music — all my playlists, including smart playlists, plus all my stats and ratings — and I would like it to be stored in a format some other application could read if I ever need to move to a different client in the future.
There are many indie apps that get close to this. I checked out Radiccio recently, but it unfortunately does not work with the iMac on which my music library is stored. Maybe that is the fourth criteria: backwards compatibility as far as possible.
Nobody has ever said I am easy to please.
Germain Gauthier, et al., in a recent peer-reviewed paper in Nature:
Feed algorithms are widely suspected to influence political attitudes. However, previous evidence from switching off the algorithm on Meta platforms found no political effects. Here we present results from a 2023 field experiment on Elon Musk’s platform X shedding light on this puzzle. We assigned active US-based users randomly to either an algorithmic or a chronological feed for 7 weeks, measuring political attitudes and online behaviour. Switching from a chronological to an algorithmic feed increased engagement and shifted political opinion towards more conservative positions, particularly regarding policy priorities, perceptions of criminal investigations into Donald Trump and views on the war in Ukraine. In contrast, switching from the algorithmic to the chronological feed had no comparable effects. Neither switching the algorithm on nor switching it off significantly affected affective polarization or self-reported partisanship. […]
One can be pedantic about the use of “algorithmic” and “the algorithm” to describe a particular set of rules for recommending tweets, given that you could also say a reverse-chronological timeline is its own kind of algorithm. A simple one, to be sure, but an algorithm. I will not quibble with this.
Here is one thing I will be pedantic about, though: this study is not an examination of the “political effects of X’s feed algorithm”, as the title of the study suggests. It was conducted in 2023 — just a little bit after Elon Musk bought the platform and when it was still named Twitter. That is a long time ago in online platform terms, and the recommendations engine has probably changed a lot since — but almost certainly not in the direction of political even-handedness — even though the GitHub commit log suggests it has not been.
This study’s design seems better to me than a report published shortly after the 2024 U.S. presidential election, which I found limited and unconvincing.
There should always be a way for users to set a reverse-chronological timeline, and to opt out of recommendations features. We should be suspicious of any platform that refuses to trust us with control over our own experience.
Samantha Ryan, “VP of Content” at Meta’s Reality Labs:
We’ve recently made some pretty big changes, including right-sizing our Reality Labs investment to ensure that our efforts remain sustainable over time. We’ve been in this space for over a decade, and we aren’t going anywhere. We’re in it for the long haul.
By “right-sizing”, Ryan means laying off ten percent of the Reality Labs workforce, and pouring money into the Ray-Ban partnership instead of metaverse initiatives. By “in it for the long haul”, Ryan means shifting the definition of the “metaverse” to meet Mark Zuckerberg’s latest obsession. They did not whiff by renaming the entire company around a crappy update to Second Life; you just are not getting it.
Ryan:
Our goal remains constant: to empower developers and creators as they build long-term, sustainable businesses. We used to have a pretty well-defined audience for VR, but as we’ve grown, we’ve attracted new audiences — who want different things — and the onus is on us to make sure that each of these distinct groups can find the apps and games that appeal to them.
That’s why we’re changing our roadmaps to increase your chances for success. We’re explicitly separating our Quest VR platform from our Worlds platform in order to create more space for both products to grow. We’re doubling down on the VR developer ecosystem while shifting the focus of Worlds to be almost exclusively mobile. By breaking things down into two distinct platforms, we’ll be better able to clearly focus on each.
Meta can say it is “doubling down on the V.R. developer ecosystem” all it wants, but it announced in January it would be shutting down its work-focused V.R. app with only a month’s notice, and it has cancelled third-party headsets. Now, it is saying Horizon Worlds is basically a phone app. Last February, Andrew Bosworth wrote in a memo about the importance of this very strategy:
[…] And Horizon Worlds on mobile absolutely has to break out for our long term plans to have a chance. […]
As I write this, Meta Horizon is the fifty-seventh most popular free game in the Canadian App Store, just two spots behind Hole.io, “the most addictive black hole game”. Maybe people do not, in general, want to wear a computer on their entire head — not for the thousands of dollars Apple is charging, and not for the hundreds Meta is.
For years, I’ve wanted a personal assistant. Someone who knows my preferences, manages my inbox, tracks my packages, and helps my family stay organized. The problem? Good assistants are expensive, require training, and still need constant direction.
So I built one. His name is Lobster. 🦞
The key insight that made this work wasn’t technical—it was conceptual. I stopped thinking “AI chatbot” and started thinking “new hire.”
I think this analogy is downright perfect.
When I first read this piece, my mind started to spin with all the things I could offload to my own digital personal assistant. Imagine how much time I could save by… wait. What could I use it for? Shahine says it helps summarize recent emails, figure out travel details, find event tickets, and more, all through iMessage conversations. This is a remarkable technical achievement. But what it drove home for me is how little I could ultimately relate to the scenarios presented by Shahine, even as I am trying to plan dinner with friends and a couple of trips later in the year.
Perhaps the same is true for you, too. Take a moment and think about what tasks you would give a personal assistant that can only work through software. Is it a long list? Is delegating checking your email saving you time? If you automate your vacation planning, does it make you happier than figuring that out alongside your partner or family? I am not saying Shahine is wrong or misguided. I just cannot see my life in this, and I do not think I am alone.
Somewhat recently, GeePaw Hill shared the story of what he called his most humiliating experience as a skilled and successful computer programmer. It's an excellent, entertaining story with a lesson for all of us, so I urge you to read it. Today I'm going to tell the story of one of my great failures, where I may have quietly killed part of a professor's research project by developing on a too-small machine.
Once upon a time, back when I was an (advanced) undergraduate, I was hired as a part time research programmer for a Systems professor to work on one of their projects, at first with a new graduate student and then later alone (partly because the graduate student switched from Systems to HCI). One of this professor's research areas was understanding and analyzing disk IO patterns (a significant research area at the time), and my work was to add detailed IO tracing to the Ultrix kernel. Some of this was porting work the professor had done with the 4.x BSD kernel (while a graduate student and postdoc) into the closely related, BSD-derived Ultrix kernel, but we extended the original filesystem level tracing down all the way to capturing block IO traces (still specifically attributed to filesystem events).
We were working on Ultrix because my professor had a research and equipment grant from DEC. DEC was interested in this sort of information for improving the IO performance of the Ultrix kernel, and part of the benefit of working with DEC was that DEC could arrange for us to get IO traces from real customers with real workloads, instead of university research system workloads. Eventually the modified kernel worked, gathered all the data that we wanted (and gave us some insights even on our systems), and was ready for the customer site. We talked to DEC and it was decided that the best approach was that I would go down to Boston with the source code, meet with the DEC people involved, we'd build a kernel for the customer's setup, and then I'd go with the DEC people to the customer site to actually boot into it and turn the tracing on.
Very shortly after we booted the new kernel on the customer's machine and turned tracing on, the kernel paniced. It was a nice, clear panic message from my own code, basically an assertion failure, and what it said was more or less 'disk block number too large to fit into data field'. I looked at that and had a terrible sinking feeling.
This was long enough ago (with small enough disks) that having very compact trace data was extremely important, especially at the block IO layer (where we were generating a lot of trace records). As a result, I'd carefully designed the on-disk trace records to be as small as possible. As part of that I'd tried to cut down the size of fields to be only as big as necessary, and one of the fields I'd minimized was the disk block address of the IO. My minimized field was big enough for the block addresses on our Ultrix machines (donated by DEC), with not very big disks, but it was now obviously too small for the bigger disks that the company had bought from DEC for their servers. In a way I was lucky that I'd taken the precaution of putting in the size check that paniced, because otherwise we could have happily wasted time collecting corrupted traces with truncated block addresses.
(All of this was long enough ago that I can't remember how small the field was, although my mind wants to say 24 bits. If it was 24 bits, I had to be using 4 Kbyte filesystem block addresses, not 512-byte sector addresses.)
Once I saw the panic message, both the mistake and the fix were obvious, and the code and so on were well structured enough that it was simple to make the change; I could almost have done it on the spot (or at least while in Boston). But, well, you only get one kernel panic from your new "we assure you this is going to work" kernel on a customer's machine, especially if you only have one evening to gather your trace data and you can't rebuild a kernel from source while at the customer's site, so the DEC people and I had to pack up and go back empty handed. Afterward, I flew back to Toronto from Boston, made the simple change, and tested everything. But I never went back to Boston for another visit with DEC, and I don't think that part of my professor's research projects went anywhere much after that.
(My visit to Boston and its areas did feature getting driven around at somewhat unnervingly fast speeds on the Massachusetts Turnpike in the sports car of one of the DEC people involved.)
So that's the story of how I may have quietly killed one of my professor's research projects by developing on a too-small machine.
(That's obviously not the only problem. When I was picking the field size, I could have reached out somehow to ask how big DEC's disks got, or maybe ran the field size past my professor to see if it made sense. But I was working alone and being trusted with all of this, and I was an undergraduate, although I had significant professional programming experience by then.)
(All of the following is based on my fallible memory.)
The tracing code worked by adding trace records to a buffer in memory and then writing out the buffer to the trace file when it was necessary. The BSD version of the code that I started with (which traced only filesystem level IO) did this synchronously, created trace records even for writing out the trace buffer, and didn't protect itself against being called again. A recursive call would deadlock but usually it all worked because you didn't add too many new trace records while writing out the buffer.
(Basically, everything that added a trace record to the buffer checked to see if the buffer was too full and if it was, immediately called the 'flush the trace buffer' code.)
This approach blew up spectacularly when I added block IO tracing; the much higher volume of records being added made deadlocks relatively common. The whole approach to writing out the trace buffer had to change completely, into a much more complex one with multiple processes involved and genuinely asynchronous writeout. I still have a vivid memory of making this relatively significant restructuring and then doing a RCS ci with a commit message that included a long, then current computing quote about replacing one set of code with known bugs with a new set of code with new unknown ones.
(At this remove I have no idea what the exact quote was and I can't find it in a quick online search. And unfortunately the code and its RCS history is long since gone.)
Late Friday night, the university's downtown campus experienced some sort of power glitch or power event. A few machines rebooted, a number of machines dropped out of contact for a bit (which probably indicates some switches restarting), and most significantly, some of our switches wound up in a weird, non-working state despite being powered on. This morning we cured the situation by fully power cycling all of them.
This isn't the first time we've seen brief power glitches leave things in unusual states. In the past we've seen it with servers, with BMCs (IPMIs), and with switches. It's usually not every machine, either; some machines won't notice and some will. When we were having semi-regular power glitches, there were definitely some models of server that were more prone to problems than others, but even among those models it usually wasn't universal.
It's fun to speculate about reasons why some particular servers of a susceptible model would survive and others not, but that's somewhat beside today's point, which is that power glitches can get your hardware into weird states (and your hardware isn't broken when and because this happens; it can happen to hardware that's in perfectly good order). We'd like to think that the computers around us are binary, either shut off entirely or working properly, but that clearly isn't the case. A power glitch like this peels back the comforting illusion to show us the unhappy analog truth underneath. Modern computers do a lot of work to protect themselves from such analog problems, but obviously it doesn't always work completely.
(My wild speculation is that the power glitch has shifted at least part of the overall system into a state that's normally impossible, and either this can't be recovered from or the rest of the system doesn't realize that it has to take steps to recover, for example forcing a full restart. See also flea power, where a powered off system still retains some power, and sometimes this matters.)
PS: We've also had a few cases where power cycling the hardware wasn't enough, which is almost certainly flea power at work.
PPS: My steadily increasing awareness of the fundamentally analog nature of a lot of what I take as comfortably digital has come in part from exposure on the Fediverse to people who deal with fun things like differential signaling for copper Ethernet, USB, and PCIe, and the spooky world of DDR training, where very early on your system goes to some effort to work out the signal characteristics of your particular motherboard, RAM, and so on so that it can run the RAM as fast as possible (cf).
(Never mind all of the CPU errata about unusual situations that aren't quite handled properly.)
One of the things people put in their HTTP User-Agent header for non-browser software is a URL for their software, project, or whatever (I'm all for this). This is a a good thing, because it allows people operating web servers to check out who and what you are and decide for themselves if they're going to allow it. Increasingly (and partly for social reasons), I block many 'generic' User-Agent values that come to my attention, for example through their volume.
(I don't block all of them, but if your User-Agent shows up and I can't figure out what it is and whether or not it's legitimate and used by real people, that's probably a block.)
However, there's an important and obvious thing about any URLs in your HTTP User-Agent, which is that they should actually work. The domain or host should exist, the URL should exist in the web server, and the URL's contents should actually explain the software, project, or organization involved. Plus, if you use a HTTPS website, the TLS certificate should be valid.
(A related thing is a generic URL that doesn't give me anything to go on. For example, your URL on a code forge, and either it's not obvious which one of your repositories is doing things or you don't have any public repositories.)
For me, a non-working URL is much more suspicious than a missing URL. HTTP User-Agents without URLs are reasonably common (especially in feed readers), so I don't find them immediately suspicious. Non-working URLs in mysterious User-Agents certainly look like you're attempting to distract me with the appearance of a proper web agent but without the reality of it. If a User-Agent with such a non-working URL comes to my attention, I'm very likely to block it in some way (unless it's very clear that it's a legitimate program used by real people, and it merely has bad habits with its User-Agent).
You would think that people wouldn't make this sort of mistake, but I regret to say that I've seen it repeatedly, in all of the variations. One interesting version I've seen is User-Agent strings with the various 'example.<TLD>' domains in their URLs. I suspect that this comes from software that has some sort of 'operator URL' setting and provides a default value if you don't set one explicitly. I've also seen .lan and .local URLs in User-Agents, which takes somewhat more creativity.
As usual, my view is that software shouldn't provide this sort of default value; instead, it should refuse to work until you configure your own value. However, this makes it slightly more annoying to use, so it will be less popular than more accommodating software. Of course, we can change that calculation by blocking everything that mentions 'example.com', 'example.org', 'example.net' and so on in its User-Agent.
The other day I covered how I think systemd's IPAddressAllow and IPAddressDeny restrictions work, which unfortunately only allows you to limit this to specific (local) ports only if you set up the sockets for those ports in a separate systemd.socket unit. Naturally this raises the question of whether there is a good, scalable way to restrict access to specific ports in eBPF that systemd (or other interested parties) could use. I think the answer is yes, so here is a sketch of how I think you'd this.
Why we care about a 'scalable' way to do this is because systemd generates and installs its eBPF programs on the fly. Since tcpdump can do this sort of cross-port matching, we could write an eBPF program that did it directly. But such a program could get complex if we were matching a bunch of things, and that complexity might make it hard to generate on the fly (or at least make it complex enough that systemd and other programs didn't want to). So we'd like a way that still allows you to generate a simple eBPF program.
Systemd uses cgroup socket SKB eBPF programs, which attach to a cgroup and filter all network packets on ingress or egress. As far as I can understand from staring at code, these are implemented by extracting the IPv4 or IPv4 address of the other side from the SKB and then querying what eBPF calls a LPM (Longest Prefix Match) map. The normal way to use an LPM map is to use the CIDR prefix length and the start of the CIDR network as the key (for individual IPv4 addresses, the prefix length is 32), and then match against them, so this is what systemd's cgroup program does. This is a nicely scalable way to handle the problem; the eBPF program itself is basically constant, and you have a couple of eBPF maps (for the allow and deny sides) that systemd populates with the relevant information from IPAddressAllow and IPAddressDeny.
However, there's nothing in eBPF that requires the keys to be just CIDR prefixes plus IP addresses. A LPM map key has to start with a 32-bit prefix, but the size of the rest of the key can vary. This means that we can make our keys be 16 bits longer and stick the port number in front of the IP address (and increase the CIDR prefix size appropriately). So to match packets to port 22 from 128.100.0.0/16, your key would be (u32) 32 for the prefix length then something like 0x00 0x16 0x80 0x64 0x00 0x00 (if I'm doing the math and understanding the structure right). When you query this LPM map, you put the appropriate port number in front of the IP address.
This does mean that each separate port with a separate set of IP address restrictions needs its own set of map entries. If you wanted a set of ports to all have a common set of restrictions, you could use a normally structured LPM map and a second plain hash map where the keys are port numbers. Then you check the port and the IP address separately, rather than trying to combine them in one lookup. And there are more complex schemes if you need them.
Which scheme you'd use depends on how you expect port based access restrictions to be used. Do you expect several different ports, each with its own set of IP access restrictions (or only one port)? Then my first scheme is only a minor change from systemd's current setup, and it's easy to extend it to general IP address controls as well (just use a port number of zero to mean 'this applies to all ports'). If you expect sets of ports to all use a common set of IP access controls, or several sets of ports with different restrictions for each set, then you might want a scheme with more maps.
(In theory you could write this eBPF program and set up these maps yourself, then use systemd resource control features to attach them to your .service unit. In practice, at that point you probably should write host firewall rules instead, it's likely to be simpler. But see this blog post and the related VCS repository, although that uses a more hard-coded approach.)
I recently wrote about things that make me so attached to xterm. One of those things is xterm's ziconbeep feature, which causes xterm to visibly and perhaps audibly react when it's iconified or minimized and gets output. A commentator suggested that this feature should ideally be done in the window manager, where it could be more general. Unfortunately we can't do the equivalent of ziconbeep in the window manager, or at least we can't do all of it.
A window manager can sound an audible alert when a specific type of window changes its title in a certain way. This would give us the 'beep' part of ziconbeep in a general way, although we're treading toward a programmable window manager. But then, Gnome Shell now does a lot of stuff in JavaScript and its extensions are written in JS and the whole thing doesn't usually blow up. So we've got prior art for writing an extension that reacts to window title changes and does stuff.
What the window manager can't really do is reliably detect when the window has new output, in order to trigger any beeping and change the visible window title. As far as I know, neither X nor Wayland give you particularly good visibility into whether the program is rendering things, and in some ways of building GUIs, you're always drawing things. In theory, a program might opt to detect that it's been minimized and isn't visible and so not render any updates at all (although it will be tracking what to draw for when it's not minimized), but in practice I think this is unfashionable because it gets in the way of various sorts of live previews of minimized windows (where you want the window's drawing surface to reflect its current state).
Another limitation of this as a general window manager feature is that the window manager doesn't know what changes in the appearance of a window are semantically meaningful and which ones are happening because, for example, you just changed some font preference and the program is picking up on that. Only the program itself knows what's semantically meaningful enough to signal for people's attention. A terminal program can have a simple definition but other programs don't necessarily; your mail client might decide that only certain sorts of new email should trigger a discreet 'pay attention to me' marker.
(Even in a terminal program you might want more control over this than xterm gives you. For example, you might want the terminal program to not trigger 'zicon' stuff for text output but instead to do it when the running program finishes and you return to the shell prompt. This is best done by being able to signal the terminal program through escape sequences.)
Among the systemd resource controls
are IPAddressAllow= and IPAddressDeny=,
which allow you to limit what IP addresses your systemd thing can
interact with. This is implemented with eBPF.
A limitation of these as applied to systemd .service units is that
they restrict all traffic, both inbound connections and things your
service initiates (like, say, DNS lookups), while you may want
only a simple inbound connection filter.
However, you can also set these on systemd.socket
units. If you do, your IP address restrictions apply only to the socket (or
sockets), not to the service unit that it starts. To quote the
documentation:
Note that for socket-activated services, the IP access list configured on the socket unit applies to all sockets associated with it directly, but not to any sockets created by the ultimately activated services for it.
So if you have a systemd socket activated service, you can control who can access the socket without restricting who the service itself can talk to.
In general, systemd IP access controls are done through eBPF programs set up on cgroups. If you set up IP access controls on a socket, such as ssh.socket in Ubuntu 24.04, you do get such eBPF programs attached to the ssh.socket cgroup (and there is a ssh.socket cgroup, perhaps because of the eBPF programs):
# pwd
/sys/fs/cgroup/system.slice
# bpftool cgroup list ssh.socket
ID  AttachType      AttachFlags  Name
12  cgroup_inet_ingress   multi  sd_fw_ingress
11  cgroup_inet_egress    multi  sd_fw_egress
However, if you look there are no processes or threads in the ssh.socket cgroup, which is not really surprising but also means there is nothing there for these eBPF programs to apply to. And if you dump the eBPF program itself (with 'ebpftool dump xlated id 12'), it doesn't really look like it checks for the port number.
What I think must be going on is that the eBPF filtering program
is connected to the SSH socket itself. Since I can't find any
relevant looking uses in the systemd code of the `SO_ATTACH_*'
BPF related options from socket(7) (which
would be used with setsockopt(2) to
directly attach programs to a socket), I assume that what happens
is that if you create or perhaps start using a socket within a
cgroup, that socket gets tied to the cgroup and its eBPF programs,
and this attachment stays when the socket is passed to another
program in a different cgroup.
(I don't know if there's any way to see what eBPF programs are attached to a socket or a file descriptor for a socket.)
If this is what's going on, it unfortunately means that there's no way to extend this feature of socket units to get per-port IP access control in .service units. Systemd isn't writing special eBPF filter programs for socket units that only apply to those exact ports, which you could in theory reuse for a service unit; instead, it's arranging to connect (only) specific sockets to its general, broad IP access control eBPF programs. Programs that make their own listening sockets won't be doing anything to get eBPF programs attached to them (and only them), so we're out of luck.
(One could experiment with relocating programs between cgroups, with the initial cgroup in which the program creates its listening sockets restricted and the other not, but I will leave that up to interested parties.)
I have a Python program that calculates and prints various pieces of Linux memory information on a per-cgroup basis. In the beginning, its life was simple; cgroups had a total memory use that was split between 'user' and '(filesystem) cache', so the program only needed to display either one field or a primary field plus a secondary field. Then I discovered that there was additional important (ie, large) kernel memory use in cgroups and added the ability to report it as an additional option for the secondary field. However, this wasn't really ideal, because now I had a three-way split and I might want to see all three things at once.
A while back I wrote up my realization about flexible string formatting with named arguments. This sparked all sorts of thoughts about writing a general solution for my program that could show any number of fields. Recently I took a stab at implementing this and rapidly ran into problems figuring out how I wanted to do it. I had multiple things that could be calculated and presented, I had to print not just the values but also a header with the right field names, I'd need to think about how I structured argparse argument groups in light of argparse not supporting nested groups, and so on. At a minimum this wasn't going to be a quick change; I was looking at significantly rewriting how the program printed its output.
The other day, I had an obvious realization: while it would be nice to have a fully general solution that could print any number of additional fields, which would meet my needs now and in the future, all that I needed right now was an additional three-field version with the extra fields hard-coded and the whole thing selected through a new command line argument. And this command line argument could drop right into the existing argparse exclusive group for choosing the second field, even though this feels inelegant.
(The fields I want to show are added with '-c' and '-k' respectively in the two field display, so the morally correct way to select both at once would be '-ck', but currently they're exclusive options, which is enforced by argparse. So I added a third option, literally '-b' for 'both'.)
Actually implementing this hard-coded version was a bit annoying for structural reasons, but I put the whole thing together in not very long; certainly it was much faster than a careful redesign and rewrite (in an output pattern I haven't used before, no less). It's not necessarily the right answer for the long term, but it's definitely the right answer for now (and I'm glad I talked myself into doing it).
(I'm definitely tempted to go back and restructure the whole output reporting to be general. But now there's no rush to it; it's not blocking a feature I want, it's a cleanup.)
One of my long standing gripes with Debian and Ubuntu is, well, I'll quote myself on the Fediverse:
I understand that Debian wants me to use 'apt' instead of apt-get, but the big reason I don't want to is because you can't turn off that progress bar at the bottom of your screen (or at least if you can it's not documented). That curses progress bar is something that I absolutely don't want (and it would make some of our tooling explode, yes we have tooling around apt-get).
Over time, I've developed opinions on what I want to see tools do for progress reports and other text output, and what I feel is increasingly too clever in tools that makes them more and more inconvenient for me. Today I'm going to try to run down that taxonomy, from best to worst.
less have some
ability to handle backspaces, but this will give you heartburn in
your own programs.
less and anything that already deals with
backspacing over things will generally be able to handle this.
I believe apt-get does this.
script and then
look over them later with pagers like less, although
less can process a limited amount of terminal codes, including
colours.
less to
display, search, or analyze and process. However, your terminal
program of choice is probably still going to see this as line by
line output and preserve various aspects of scrollback and so on.
top. In some environments this may damage or destroy
terminal scrollback.
An additional reason I dislike this style is that it causes output
to not appear at the current line. When I run your command line
program, I want your program to print its output right below where
I started it, in order, because that's what everything else does.
I don't want the output jumping around the screen to random other
locations. The only programs I accept that from are genuine full
screen programs like top. Programs that insist on displaying
things at random places on the screen are not really command line
programs, they are TUIs cosplaying being CLIs.
My strong system administrator's opinion is that if you're tempted
to do any of these other than the first, you should provide a command
line switch to turn these off. Also, you should detect unusual
settings of the $TERM environment variable, like 'dumb' or perhaps
'vt100', and automatically disable your smart output. And you should
definitely disable your smart output if $TERM isn't set or you're
not outputting to a (pseudo-)terminal.
(Programs that insist on fancy output no matter what make me very unhappy.)
I recently read Evan Hahn's The two kinds of error (via), which talks very briefly in passing about logging, and it sparked a thought. I've previously written my system administrator's view of what an error log level should mean, but that entry leaves out something fundamental about log messages, which is that under most circumstances, log messages are for the people operating your software (I've sort of said this before in a different context). When you're about to add a non-debug log message, one of the questions you should ask is what does someone running your program get out of seeing the message.
Speaking from my own experience, it's very easy to write log messages (and other messages) that are aimed at you, the person developing the program, script, or what have you. They're useful for debugging and for keeping track of the state of the program, and it's natural to write them that way since you're immersed in the program and have all of the context (this is especially a problem for infrequent error messages, which I've learned to make as verbose as possible, and a similar thing applies for infrequently logged messages). But if your software is successful (especially if it gets distributed to other people), most of the people running it won't be the developers, they'll only be operating it.
(This can include a future version of you when you haven't touched this piece of software for months.)
If you want your log messages to be useful for anything other than being mailed to you as part of a 'can you diagnose this' message, they need to be useful for the people operating the software. This doesn't mean 'only report errors that they can fix and need to', although that's part of it. It also means making the information you provide through logs be things that are useful and meaningful to people operating your software, and that they can understand without a magic decoder ring.
If people operating your software won't get anything out of seeing a log message, you probably shouldn't log it by default in the first place (or you need to reword it so that people will get something from it). In Evan Hahn's terminology, this apply to the log messages for both expected errors and unexpected errors, although if the program aborts, it should definitely tell system administrators why it did.
For a system administrator, log messages about expected errors let us diagnose what went wrong to cause something to fail, and how interested we are in them depends partly on how common they are. However, how common they are isn't the only thing. MTAs often have what would be considered relatively verbose logs of message processing and will log every expected error like 'couldn't do a DNS lookup' or 'couldn't connect to a remote machine', even though they can happen a lot. This is very useful because one thing we sometimes care a lot about is what happened to and with a specific email message.
I've said before in various contexts (eg)
that I'm very attached to the venerable xterm as my terminal
(emulator) program, and I'm not looking forward to the day that I
may have to migrate away from it due to Wayland (although I probably
can keep running it under XWayland, now that I think about it). But
I've never tried to write down a list of the things that make me
so attached to it over other alternatives like urxvt, much less
more standard ones like gnome-terminal. Today I'm going to try to
do that, although my list is probably going to be incomplete.
Yes, I can set my shell environment and many programs to not use colours, but I can't set all of them; some modern programs simply always use colours on terminals. Xterm can be set to completely ignore them.
(For instance, I'm extremely attached to double-click selecting only individual directories in full paths, rather than the entire thing. I can always swipe to select an entire path, but if I can't pick out individual path elements with a double click my only choice is character by character selection, which is a giant pain.)
Based on a quick experiment, I think I can make KDE's konsole behave more or less the way I want by clearing out its entire set of "Word characters" in profiles. I think this isn't quite how xterm behaves but it's probably close enough for my reflexes.
Of these, the hardest two to duplicate are probably xterm's double click selection behavior of what is a word and xterm's large selection behavior. The latter is hard because it requires the terminal program to not use mouse button 3 for a popup menu.
I use some other xterm features, like key binding, including duplicating windows, but I could live without them, especially if the alternate terminal program directly supports modern cut and paste in addition to xterm's traditional style. And I'm accustomed to a few of xterm's special control characters, especially Ctrl-space, but I think this may be pretty universally supported by now (Ctrl-space is in gnome-terminal).
There are probably things that other terminal programs like konsole, gnome-terminal and so on do that I don't want them to (and that xterm doesn't). But since I don't use anything other than xterm (and a bit of gnome-terminal and once in a while a bit of urxvt), I don't know what those undesired features are. Experimenting with konsole for this entry taught me some things I definitely don't want, such as it automatically placing itself where it was before (including placing a new konsole window on top of one of the existing ones, if you have multiple ones).
(This elaborates on a comment I made elsewhere.)
Back when we had just started with our current metrics and dashboards adventure, I wrote about how sometimes the simplest version of a graph is a text table. Today I will extend that further: sometimes the simplest version of a text table is to have a command that prints it out, rather than making people look at a web page.
We recently had a major power outage at work, and in the aftermath not all of our machines came back. One of my co-workers is an extreme early bird and he came in to the university about as early as it's possible to on the TTC, and started work on troubleshooting what was going on. One of the things he needed to know was what machines were still down, so he could figure out any common elements to them (and see what machines were stubbornly not coming back on even though they ought to be).
We have Grafana dashboards for this, and the information about what machines are down is present in some of them in tabular form. But it's a table embedded in a widget in a web page, and you need a browser to look at it, which you may not have from the server console of some server you just powered up. Since I like command line tools, at one point I wrote some little scripts that make queries to our Prometheus server with curl and run the result through 'jq' to extract things. One of them is called 'promdownhosts' and it prints out what you'd expect. Initially this was just something I used, but several years ago I mentioned my collection of these scripts to my co-workers and we wound up making them group scripts in a central location.
(I initially wrote this script and a few others for use during our planned power outages and other downtimes, because it was a convenient way of seeing what we hadn't yet turned on or might have missed.)
Early in the morning of that Tuesday, bringing machines back up after the power outage and finding dead PDUs, my co-worker used the 'promdownhosts' script extensively to troubleshoot things. One of the nice aspects of it being a script was that he could put the names of uninteresting machines in a file and then exclude them easily with things like 'promdownhosts | fgrep -v -f /tmp/ignore-these' (something that's much harder to do in a web page dashboard interface, especially if the designer hasn't thought of that). And in general, the script made (and makes) this information quite readily accessible in a compact format that was quick to skim and definitely free of distractions.
Not everything can be presented this way, in a list or a table printed out in plain text from a command line tool. Sometimes tables on a web page are the better option, and it's good to have options in general; sometimes we want to look at this information along with other information too. As I've found out the hard way sometimes, there's only so much information you can cram into a plain text table before the result is increasingly hard to read.
(I have a command that summarizes our current Prometheus alerts and its output is significantly harder to read because I need it to be compact and there's more information to present. It's probably only really suitable for my use because I understand all of its shorthand notations, including the internal Prometheus names for our alerts.)
One of the famous things that people run into with the Bourne shell is that it draws a distinction between plain shell variables and special exported shell variables, which are put into the environment of processes started by the shell. This distinction is a source of frustration when you set a variable, run a program, and the program doesn't have the variable available to it:
$ GODEBUG=...
$ go-program
[doesn't see your $GODEBUG setting]
It's also a source of mysterious failures, because more or less all
of the environment variables that are present automatically become
exported shell variables. So whether or not 'GODEBUG=..; echo
running program; go-program' works can depend on whether $GODEBUG
was already set when your shell started. The environment variables
of regular shell sessions are usually fairly predictable, but the
environment variables present when shell scripts get run can be
much more varied. This makes it easy to write a shell script that
only works right for you, because in your environment it runs with
certain environment variables set and so they automatically become
exported shell variables.
I've told you all of that because despite these pains, I believe that the Bourne shell made the right choice here, in addition to a pragmatically necessary choice at the time it was created, in V7 (Research) Unix. So let's start with the pragmatics.
The Bourne shell was created along side environment variables themselves, and on the comparatively small machines that V7 ran on, you didn't have much room for the combination of program arguments and the new environment. If either grew too big, you got 'argument list too long' when you tried to run programs. This made it important to minimize and control the size of the environment that the shell gave to new processes. If you want to do that without limiting the use of shell variables so much, a split between plain shell variables and exported ones makes sense and requires only a minor bit of syntax (in the form of 'export').
Both machines and exec() size limits are much larger now, so you
might think that getting rid of the distinction is a good thing.
The Bell Labs Research Unix people thought so, so they did do this
in Tom Duff's rc shell for V10 Unix and Plan 9. Having used both
the Bourne shell and a version of rc for
many years, I both agree and disagree with them.
For interactive use, having no distinction between shell variables
and exported shell variables is generally great. If I set $GODEBUG,
$PYTHONPATH, or any number of any other environment variables that
I want to affect programs I run, I don't have to remember to do a
special 'export' dance; it just works. This is a sufficiently
nice (and obvious) thing that it's an option for the POSIX 'sh',
in the form of 'set -a'
(and this set option is present in more or less all modern Bourne
shells, including Bash).
('Set -a' wasn't in the V7 sh, but I haven't looked to see where it came from. I suspect that it may have come from ksh, since POSIX took a lot of the specification for their 'sh' from ksh.)
For shell scripting, however, not having a distinction is messy and
sometimes painful. If I write an rc script, every shell variable
that I use to keep track of something will leak into the environment
of programs that I run. The shell variables for intermediate results,
the shell variables for command line options, the shell variables
used for for loops, you name it, it all winds up in the environment
unless I go well out of my way to painfully scrub them all out. For
shell scripts, it's quite useful to have the Bourne shell's strong
distinction between ordinary shell variables, which are local to
your script, and exported shell variables, which you deliberately
act to make available to programs.
(This comes up for shell scripts and not for interactive use because you commonly use a lot more shell variables in shell scripts than you do in interactive sessions.)
For a new Unix shell today that's made primarily or almost entirely for interactive use, automatically exporting shell variables into the environment is probably the right choice. If you wanted to be slightly more selective, you could make it so that shell variables with upper case names are automatically exported and everything else can be manually exported. But for a shell that's aimed at scripting, you want to be able to control and limit variable scope, only exporting things that you explicitly want to.
In some sorts of shell scripts, you often find yourself wanting to
work through a bunch of input in the shell; some examples of this
for me are here and here. One of the tools for this is a
'while read -r ...' loop, using the shell's builtin read to
pull in one or more fields of data (hopefully not making a mistake).
Suppose, not hypothetically, that you have a situation where you
want to use such a 'while read' loop to accumulate some information
from the input, setting shell variables, and then using them later.
The innocent and non-working way to write this is:
accum=""
sep=""
some-program |
while read -r avalue; do
   accum="$accum$sep$avalue"
   sep=" or "
done

# Now we want to use $accum
(The recent script where I ran into this issue does much more complex things in the while loop that can't easily be done in other ways.)
This doesn't work because the 'while' is actually happening in a subshell, so the shell variables it sets are lost at the end. To make this work we have to wrap everything from the 'while ...' onward up into a subshell, with that part looking like:
some-program |
(
while read -r avalue; do
   accum="$accum$sep$avalue"
   sep=" or "
done
[...]
)
(You can't get around this with '{ while ...; ... done; }', Bash will still put the 'while' in a subshell.)
The way around this starts with how you can use a file redirection
with a while loop (it goes on the 'done'):
some-program >/some/file
while read -r avalue; do
  [...]
done </some/file
# $accum is still set
So far this is all generic Bourne shell things. Bash has a special feature of process substitution, which allows us to use a process instead of a file, using the otherwise illegal syntax '<(...)'. This is great and exactly what we want to avoid creating a temporary file and then have to clean it up. So the innocent and obvious way to try to write things is this:
while read -r avalue; do
  [...]
done <(some-program)
If you try this, you will get the sad error message from Bash of:
line N: syntax error near unexpected token `<(some-program)'
line N: 'done <(some-program)'
This is not a helpful error message. I will start by telling you the cure, and then what is going on at a narrow technical level to produce this error message. The cure is:
while read -r avalue; do
  [...]
done < <(some-program)
Note that you must have a space between the two <'s, writing this as '<<(some-program)' will get you a similar syntax error.
The technical reason for this error is that although it looks like
redirection, process substitution is a form of substitution,
like '$var' (it's in the name, but you, like me, may not know
what Bash calls it off the top of your head). The result of process
substitution will be, for example, a /dev/fd/N name (and a subprocess
that is running our 'some-program' and feeding into the other end
of the file descriptor). We can see this directly:
$ echo <(cat /dev/null)
/dev/fd/63
(Your number may vary.)
You can't write 'while ...; done /dev/fd/63'. That's a syntax
error. Even though the pre-substitution version looks like
redirection, it's not, so it's not accepted.
That '<(...)' is actually a substitution is why our revised version works. Reading '< <(some-program)' right to left, the '<(some-program)' is process substitution, and it (along with other shell expansions) are done first, before redirections. After substitution this looks like '< /dev/fd/NN', which is acceptable syntax. If we leave out the space and write this as '<<(some-program)', the shell throws up its hands at the '<<' bit.
(So from Bash's perspective, this is very similar to 'file=/some/file;
while ... ; done < $file', which is perfectly legal.)
PS: Before I wrote this entry, I didn't know how to get around the 'done <(some-program)' syntax error. Until the penny dropped about the difference between redirections and process substitution, I thought that Bash simply forbade this to make its life easier.
Suppose that you have a disk or filesystem cache in memory (which you do, since pretty much everything has one these days). Most disk caches will give you simple hit and miss information as part of their basic information, but if you're interested in the performance of your disk cache (or in improving it), you want more information. The problem with disk caches is that there are a lot of different sources and types of disk IO, and you can have hit rates that are drastically different between them. Your hit rate for reading data from files may be modest, while your hit rate on certain sorts of metadata may be extremely high. Knowing this is important because it means that your current good performance on things involving that metadata is critically dependent on that hit rate.
(Well, it may be, depending on what storage media you're using and what its access speeds are like. A lot of my exposure to this dates from the days of slow HDDs.)
This potential vast difference is why you want more detailed information in both cache metrics and IO traces. The more narrowly you can attribute IO and the more you know about it, the more useful things you can potentially tell about the performance of your system and what matters to it. This is not merely 'data' versus 'metadata', and synchronous versus asynchronous; ideally you want to know the sort of metadata read being done, and whether the file data being read is synchronous or not, and whether this is a prefetching read or a 'demand' read that really needs the data.
A lot of the times, operating systems are not set up to pass this information down through all of the layers of IO from the high level filesystem code that knows what it's asking for to the disk driver code that's actually issuing the IOs. Part of the reason for this is that it's a lot of work to pass all of this data along, which means extra CPU and memory on what is an increasingly hot path (especially with modern NVMe based storage). These days you may get some of this fine grained details in metrics and perhaps IO traces (eg, for (Open)ZFS), but probably not all the way to types of metadata.
Of course, disk and filesystem caches (and IO) aren't the only place that this can come up. Any time you have a cache that stores different types of things that are potentially queried quite differently, you can have significant divergence in the types of activity and the activity rates (and cache hit rates) that you're experiencing. Depending on the cache, you may be able to get detailed information from it or you may need to put more detailed instrumentation into the code that queries your somewhat generic cache.
Modern general observability features in operating systems can sometimes let you gather some of this detailed attribute yourself (if the OS doesn't already provide them). However, it's not a certain thing and there are limits; for example, you may have trouble tracing and tracking IO once it gets dispatched asynchronously inside the OS (and most OSes turn IO into asynchronous operations before too long).
We have a number of systems where we traditionally set strict overcommit handling, and for some time this has caused us some heartburn. Some years ago I speculated that we might want to use resource controls on user.slice or systemd.slice if they worked, and then recently in a comment here I speculated that this was the way to (relatively) safely limit memory use if it worked.
Well, it does (as far as I can tell, without deep testing). If you
want to limit how much of the system's memory people who log in can
use so that system services don't explode, you can set MemoryMin=
on system.slice to guarantee some amount of memory to it and all
things under it. Alternately, you can set MemoryMax=
on user.slice, collectively limiting all user sessions to that
amount of memory. In either case my view is that you might want to
set MemorySwapMax=
on user.slice so that user sessions don't spend all of their time
swapping. Which one you set things on depends on which is easier
and you trust more; my inclination is MemoryMax, although that
means you need to dynamically size it depending on this machine's
total memory.
(If you want to limit user memory use you'll need to make sure that things like user cron jobs are forced into user sessions, rather than running under cron.service in system.slice.)
Of course this is what you should expect, given systemd's documentation and the kernel documentation. On the other hand, the Linux kernel cgroup and memory system is sufficiently opaque and ever changing that I feel the need to verify that things actually do work (in our environment) as I expect them to. Sometimes there are surprises, or settings that nominally work but don't really affect things the way I expect.
This does raise the question of how much memory you want to reserve for the system. It would be nice if you could use systemd-cgtop to see how much memory your system.slice is currently using, but unfortunately the number it will show is potentially misleadingly high. This is because the memory attributed to any cgroup includes (much) more than program RAM usage. For example, on our it seems typical for system.slice to be using under a gigabyte of 'user' RAM but also several gigabytes of filesystem cache and other kernel memory. You probably want to allow for some of that in what memory you reserve for system.slice, but maybe not all of the current usage.
(You can get the current version of the 'memdu' program I use as memdu.py.)
On the Fediverse a while back, I said:
Ah yes, GNOME, it is of course my mistake that I used gconf-editor instead of dconf-editor. But at least now Gnome-Terminal no longer intercepts F11, so I can possibly use g-t to enter F11 into serial consoles to get the attention of a BIOS. If everything works in UEFI land.
Gnome has had at least two settings systems, GSettings/dconf (also) and the older GConf. If you're using a modern
Gnome program, especially a standard Gnome program like gnome-terminal,
it will use GSettings and you will want to use dconf-editor
to modify its settings outside of whatever Preferences dialogs it
gives you (or doesn't give you). You can also use the gsettings or dconf programs from the command
line.
(This can include Gnome-derived desktop environments like Cinnamon, which has updated to using GSettings.)
If the program you're using hasn't been updated to the latest things
that Gnome is doing, for example Thunderbird (at least as of 2024), then it will
still be using GConf. You need to edit its settings using
gconf-editor or gconftool-2, or possibly you'll need to look
at the GConf version of general Gnome settings. I don't know if
there's anything in Gnome that synchronizes general Gnome GSettings
settings into GConf settings for programs that haven't yet been
updated.
(This is relevant for programs, like Thunderbird, that use general Gnome settings for things like 'how to open a particular sort of thing'. Although I think modern Gnome may not have very many settings for this because it always goes to the GTK GIO system, based on the Arch Wiki's page on Default Applications.)
Because I've made this mistake between gconf-editor and dconf-editor more than once, I've now created a personal gconf-editor cover script that prints an explanation of the situation when I run it without a special --really argument. Hopefully this will keep me sorted out the next time I run gconf-editor instead of dconf-editor.
PS: Probably I want to use gsettings instead of dconf-editor and dconf as much as possible, since gsettings works through the GSettings layer and so apparently has more safety checks than dconf-editor and dconf do.
PPS: Don't ask me what the equivalents are for KDE. KDE settings are currently opaque to me.
Early last Tuesday there was a widespread power outage at work, which took out power to our machine rooms for about four hours. Most things came back up when the power was restored, but not everything. One of the things that had happened was that one of our rack PDUs had failed. Fixing this took a surprising amount of work.
We don't normally think about our PDUs very much. They sit there, acting as larger and often smarter versions of power bars, and just, well, work. But both power bars and PDUs can fail eventually, and in our environment rack PDUs tend to last long enough to reach that point. We may replace servers in the racks in our machine rooms, but we don't pull out and replace entire racks all that often. The result is that a rack's initial PDU is likely to stay in the rack until it fails.
(This isn't universal; there are plenty of places that install and remove entire racks at a time. If you're turning over an entire rack, you might replace the PDU at the same time you're replacing all of the rest of it. Whole rack replacement is certainly going to keep your wiring neater.)
A rack PDU failing not a great thing for the obvious reason; it's going to take out much or all of the servers in the rack unless you have dual power supplies on your servers, each connected to a separate PDU. For racks that have been there for a while and gone through a bunch of changes, often it will turn out to be hard to remove and replace the PDU. Maintaining access to remove PDUs is often not a priority either in placing racks in your machine room or in wiring things up, so it's easy for things to get awkward and encrusted. This was one of the things that happened with our failed PDU on last Tuesday; it took quite some work to extract and replace it.
(Some people might have pre-deployed spare PDUs in each rack, but we don't. And if those spare PDUs are already connected to power and turned on, they too can fail over time.)
We're fortunate that we already had spare (smart) PDUs on hand, and we had also pre-configured a couple of them for emergency replacements. If we'd had to order a replacement PDU, things would obviously have been more of a problem. There are probably some research groups around here with their own racks who don't have a spare PDU, because it's an extra chunk of money for an unlikely or uncommon contingency, and they might choose to accept a rack being down for a while.
People sometimes wonder why I care so much about HTTP conditional GETs and rate limiting for syndication feed fetchers. There are multiple reasons, including social reasons to establish norms, but one obvious one is transfer volumes. To illustrate that, I'll look at the statistics for yesterday for feed fetches of the main syndication feed for Wandering Thoughts.
Yesterday there were 7492 feed requests that got HTTP 200 responses, 9419 feed requests that got HTTP 304 Not Modified responses, and 11941 requests that received HTTP 429 responses. The HTTP 200 responses amounted to about 1.26 GBytes, with the average response size being 176 KBytes. This average response size is actually a composite; typical compressed syndication feed responses are on the order of 160 KBytes, while uncompressed ones are on the order of 540 KBytes (but there look to have been only 313 of them, which is fortunate; even still they're 12% of the transfer volume).
If feed readers didn't do any conditional GETs and I didn't have any rate limiting (and all of the requests that got HTTP 429s would still have been made), the additional feed requests would have amounted to about another 3.5 GBytes of responses sent out to people. Obviously feed readers did do conditional GETS, and 66% of their non rate limited requests were successful conditional GETs. A HTTP 200 response ratio of 44% is probably too pessimistic once we include rate limited requests, so as an extreme approximation we'll guess that 33% of the rate limited requests would have received HTTP 200 responses with a changed feed; that would amount to another 677 MBytes of response traffic (which is less than I expected). If we use the 44% HTTP 200 ratio, it's still only 903 MBytes more.
(This 44% rate may sound high but my syndication feed changes any time someone leaves a comment on a recent entry, because the syndication feed of entries includes a comment count for every entry.)
Another statistic is that 41% of syndication feed requests yesterday got HTTP 429 responses. The most prolific single IP address received 950 HTTP 429s, which maps to an average request interval of less than two minutes between requests. Another prolific source made 779 requests, which again amounts to an interval of just less than two minutes. There are over 20 single IPs that received more than 96 HTTP 429 responses (which corresponds to an average interval of 15 minutes). There is a lot of syndication feed fetching software out there that is fetching quite frequently.
(Trying to figure out how many HTTP 429 sources did conditional requests is too complex with my current logs, since I don't directly record that information.)
You can avoid the server performance impact of lots of feed fetching by arranging to serve syndication feeds from static files instead of a dynamic system (and then you can limit how frequently you update those files, effectively forcing a maximum number of HTTP 200 fetches per time interval on anything that does conditional GETs). You can't avoid the bandwidth effects, and serving from static files generally leaves you with only modest tools for rate limiting.
PS: The syndication feeds for Wandering Thoughts are so big because I've opted to default to 100 entries in them, but I maintain you should be able to do this sort of thing without having your bandwidth explode.
I have a habit of writing little scripts at work for my own use (perhaps like some number of my readers). They pile up like snowdrifts in my $HOME/adm, except they don't melt away when their time is done but stick around even when they're years obsolete. Every so often I mention one of them to my co-workers; sometimes my co-workers aren't interested, but sometimes they find the script appealing and have me put it into our shared location for 'production' scripts and programs. Sometimes, these production-ized scripts have turned out to be very useful.
(Not infrequently, having my co-workers ask me to move something into 'production' causes me to revise it to make it less of a weird hack. Occasionally this causes drastic changes that significantly improve the script.)
When I say that I mentioned my scripts to my co-workers, that makes it sound more intentional than it often is. A common pattern is that I'll use one of my scripts to get some results that I share, and then my co-workers will ask how I did it and I'll show them the command line, and then they'll ask things like "what is this ~cks/adm/<program> thing' and 'can you put that somewhere more accessible, it sounds handy'. I do sometimes mention scripts unprompted, if I think they're especially useful, but I've written a lot of scripts over time and many of them aren't of much use for anyone beside me (or at least, I think they're too weird to be shared).
If you have your own collection of scripts, maybe your co-workers would find some of them useful. It probably can't hurt to mention some of them every so often. You do have to mention specific scripts; in my experience 'here is a directory of scripts with a README covering what's there' doesn't really motivate people to go look. Mentioning a specific script with what it can do for people is the way to go, especially if you've just used the script to deal with some situation.
(One possible downside of doing this is the amount of work you may need to do in order to turn your quick hack into something that can be operated and maintained by other people over the longer term. In some cases, you may need to completely rewrite things, preserving the ideas but not the implementation.)
PS: Speaking from personal experience, don't try to write a README for your $HOME/adm unless you're the sort of diligent person who will keep it up to date as you add, change, and ideally remove scripts. My $HOME/adm's README is more than a decade out of date.
Suppose, not hypothetically, that you have a program that optionally takes a time in the past to, for example, report on things as of that time instead of as of right now. You would like to allow people to specify this time as just 'HH:MM', with the meaning being that time today (letting people do 'program --at 08:30'). This is convenient for people using your program but irritatingly hard today with the Python standard library.
(In the following code examples, I need a Unix timestamp and we're working in local time, so I wind up calling time.mktime(). We're working in local time because that's what is useful for us.)
As I discovered or noticed a long time ago, the time module is a thin shim over
the C library time functions and inherits
their behavior. One of these behaviors is that if you ask
time.strptime() to parse
a time format of '%H:%M', you get back a struct_time
object that is in 1900:
>>> import time
>>> time.strptime("08:10", "%H:%M")
time.struct_time(tm_year=1900, tm_mon=1, tm_mday=1, tm_hour=8, tm_min=10, tm_sec=0, tm_wday=0, tm_yday=1, tm_isdst=-1)
There are two solutions I can think of, the straightforward brute force approach that uses only the time module and a more theoretically correct version using datetime, which comes in two variations depending on whether you have Python 3.14 or not.
The brute force solution is to re-parse a version of the time string with the date added. Suppose that you have a series of time formats that people can give you, including '%H:%M', and you try them all until one works, with code like this:
 for fmt in tfmts:
     try:
         r = time.strptime(tstr, fmt)
         # Fix up %H:%M and %H%M
         if r.tm_year == 1900:
             dt = time.strftime("%Y-%m-%d ", time.localtime(time.time()))
             # replace original r with the revised one.
             r = time.strptime(dt + tstr, "%Y-%m-%d "+fmt)
         return time.mktime(r)
     except ValueError:
         continue
I think the correct, elegant way using only the standard library is to use datetime to combine today's date and the parsed time into a correct datetime object, which can then be turned into a struct_time and passed to time.mktime. Before Python 3.14, I believe this is:
         r = time.strptime(tstr, fmt)
         if r.tm_year == 1900:
             tm = datetime.time(hour=r.tm_hour, minute=r.tm_min)
             today = datetime.date.today()
             dt = datetime.datetime.combine(today, tm)
             r = dt.timetuple()
         return time.mktime(r)
There are variant approaches to the basic transformation I'm doing here but I think this is the most correct one.
If you have Python 3.14 or later, you have datetime.time.strptime() and I think you can do the slightly clearer:
[...]
             tm = datetime.time.strptime(tstr, fmt)
             today = datetime.date.today()
             dt = datetime.datetime.combine(today, tm)
             r = dt.timetuple()
[...]
If you can work with datetime.datetime objects, you can skip converting back to a time.struct_time object. In my case, the eventual result I need is a Unix timestamp so I have no choice.
You can wrap this up into a general function:
def strptime_today(tstr, fmt):
   r = time.strptime(tstr, fmt)
   if r.tm_year != 1900:
      return r
   tm = datetime.time(hour=r.tm_hour, minute=r.tm_min, second=r.tm_sec)
   today = datetime.date.today()
   dt = datetime.datetime.combine(today, tm)
   return dt.timetuple()
This version of time.strptime() will return the time today if given a time format with only hours, minutes, and possibly seconds. Well, technically it will do this if given any format without the year, but dealing with all of the possible missing fields is left as an exercise for the energetic, partly because there's no (relatively) reliable signal for missing months and days the way there is for years. For many programs, a year of 1900 is not even close to being valid and is some sort of mistake at best, but January 1st is a perfectly ordinary day of the year to care about.
(Now that I've written this function I may update my code to use it, instead of the brute force time package only version.)
Suppose, not hypothetically, that you have a system that uses GNU Tar for its full and incremental backups (such as Amanda). Or maybe you use GNU Tar directly for this. If you have an incremental backup tar archive, you might be interested in one or both of two questions, which are in some ways mirrors of each other: what files were deleted between the previous incremental and this incremental, or what's the state of the directory tree as of this incremental (if it and all previous backups it depends on were properly restored).
(These questions are of deep interest to people who may have deleted some amount of files but they're not sure exactly what files have been deleted.)
Handling deleted files is one of the challenges of incremental backups, with various approaches. How GNU Tar handles deleted files is sort of documented in Using tar to perform incremental dumps and Dumpdir, but the documentation doesn't explain it specifically. The simple version is that GNU Tar doesn't explicitly record deletions; instead, every incremental tar archive carries a full listing of the directory tree, covering both things that are in this incremental archive and things that come from previous ones. To deduce deleted files, you have to compare two listings of the directory tree.
(As part of this full listing, an incremental tar archive records every directory, even unchanged ones.)
You can get at these full listings with 'tar --list --incremental
--verbose --verbose --file ...', but tar prints them in an
inconvenient format. You don't get a directory tree, the way you
do with plain 'tar -t'; instead you get the Dumpdir contents
of each directory printed out separately, and it's up to you to
post-process the results to assemble a directory tree with full
paths and so on. People have probably written tools to do this,
either from tar's output or by directly reading the GNU Tar incremental
tar archive format.
In my view, GNU Tar's approach is sensible and it comes with some useful properties (although there are tradeoffs). Conveniently, you can reconstruct the full directory tree as of that point in time from any single incremental archive; you don't have to go through a series of them to build up the picture. This probably also makes things somewhat more resilient if you're missing some incremental archives in the middle, since at least you know what's supposed to be there but you don't have any copy of. Finding where a single file was deleted is better than it would be if there were explicit deletion records, since you can do a binary search across incrementals to find the first one where it doesn't appear. The lack of explicit deletion reports does make it inconvenient to determine everything that was deleted between two successive incrementals, but on the other hand you can determine what was deleted (or added) between any two tar archives without having to go through every incremental between them.
(You could say that GNU Tar incremental archives have a snapshot of the directory tree state instead of carrying a journal of changes to the state.)
Roughly speaking, there are two sorts of backups that you can make, full backups and incremental backups. At the abstract level, full backups are pretty simple; you save everything that you find. Incremental backups are more complicated because they save only the things that changed since whatever they're relative to. People want incremental backups despite the extra complexity because they save a lot of space compared to backing up everything all the time.
There are two general challenges that make incremental backups more complicated than full backups. The first challenge is reliably finding everything that's changed, in the face of all of the stuff that can change in filesystems (or other sources of data). Full backups only need to be able to traverse all of the filesystem (or part of it), or in general the data source, and this is almost always a reliable thing because all sorts of things and people use it. Finding everything that has changed has historically been more challenging because it's not something that people do often outside of incremental backups.
(And when people do it they may not notice if they're missing some things, the way they absolutely will notice if a general traversal skips some files.)
The second challenge is handling things that have gone away. Once you have a way to find everything that's changed it's not too difficult to build a backup system that will faithfully reproduce everything that definitely was there as of the incremental. All you need to do is save every changed file and then unpack the sequence of full and incremental backups on top of each other, with the latest version of any particular file overwriting any previous one. But people often want their incremental restore to reflect the state of directories and so on as of the incremental, which means removing things that have been deleted (both files and perhaps entire directory trees). This means that your incrementals need some way to pass on information about things that were there in earlier backups but aren't there now, so that the restore process can either not restore them or remove them as it restores the sequence of full and incremental backups.
While there are a variety of ways to tackle the first challenge, backup systems that want to run quickly are often constrained by what features operating systems offer (and also what features your backup system thinks it can trust, which isn't always the same thing). You can checksum everything all the time and keep a checksum database, but that's usually not going to be the fastest thing. The second challenge is much less constrained by what the operating system provides, which means that in practice it's much more on you (the backup system) to come up with a good solution. Your choice of solution may interact with how you solve the first challenge, and there are tradeoffs in various approaches you can pick (for example, do you represent deletions explicitly in the backup format or are they implicit in various ways).
There is no single right answer to these challenges. I'll go as far as to say that the answer depends partly on what sort of data and changes you expect to see in the backups and partly where you want to put the costs between creating backups and handling restores.
GNU Emacs has a core model for how it operates, and some of its weird seeming limitations are easier to understand if you internalize that model. One of them is what you have to do in GNU Emacs to get the perfectly sensible operation of 'do <X> in a new frame or window'. For instance, one of the things I periodically want to do in MH-E is 'open a folder in a new frame', so that I can go through it while keeping my main MH-E environment on my inbox to process incoming email.
If you dig through existing GNU Emacs ELisp functions, you won't
find a 'make-frame-do-operation' function, which is a bit frustrating.
GNU Emacs has a whole collection of operations for making a new
frame,
and I can run mh-visit-folder in the context of this frame, so
it seems like there should be a simple function I could invoke to
do this and create my own 'C-x 5 v' binding for 'visit MH-E folder
in other frame'.
The clue to what's going on is in the description of C-x 5 5 from the Creating Frames page of the manual, with the emphasis mine:
A more general prefix command that affects the buffer displayed by a subsequent command invoked after this prefix command (
other-frame-prefix). It requests the buffer to be displayed by a subsequent command to be shown in another frame.
GNU Emacs frames (and windows) don't run commands and show their output, they display (GNU Emacs) buffers. In order to create a frame, you must have some buffer to display on that frame, and GNU Emacs must know what it is. GNU Emacs has some relatively complex and magical code to implement the 'C-x 5 5' and 'C-x 4 4' prefix commands, but it's all still fundamentally starting from having some buffer to display, not from running a command. The code basically assumes you're running a command that will at some point try to display a buffer, and it hooks into that 'please display this buffer' operation to make the new frame or window and then display the buffer in it.
(Buffers can be created to show files, but they can also be created for a lot of other purposes, including non-file buffers created by ELisp commands that want to present text to you. All of MH-E's buffers are non-file ones, as are things like Magit's information displays.)
The corollary of this is that the most straightforward way to write
our own ELisp code to run a command in a new frame is to start out
by switching to some buffer in another frame,
such as '*scratch*', and then run our command. In an extremely
minimal form, this looks like:
(defun mh-visit-folder-other-frame (folder &optional argp)
  "...."
  (interactive [...])
  (switch-to-buffer-other-frame "*scratch*")
  (mh-visit-folder folder argp))
If you know that your command displays a specific buffer, ideally you'll check to see if that buffer exists already and switch to it instead of to some scratch buffer that you're only using because you need to tell Emacs to display some buffer (any buffer) in the new frame.
(In normal GNU Emacs environments you can be pretty confident that
there's a *scratch* buffer sitting around. GNU Emacs normally
creates it on startup and most people don't delete it. And if you're
writing your own code, you can definitely not delete it yourself.)
Now that I've written this entry, maybe I'll remember 'C-x 5 5' and
also stop feeling vaguely irritated every time I do the equivalent
by hand ('C-x 5 b', pick *scratch*, and then run my command in
the newly created frame).
PS: It's probably possible to write a general ELisp function to run another function and make any buffers it wants to show come up on another frame, using the machinery that 'C-x 5 5' does. I will leave writing this function as an exercise for my readers (although maybe it already exists somewhere).
Yesterday I wrote about the problem of giving feed readers error messages that people will actually see, because you can't just give them HTML text; in practice you have to wrap your HTML text up in a stub, single-entry syndication feed (and then serve it with a HTTP 200 success code). In many situations you're going to want to do this by replying to the initial feed request with a HTTP 302 temporary redirection that winds up on your stub syndication feed (instead of, say, a general HTML page explaining things, such as "this resource is out of service but you might want to look at ...").
Yesterday I put this into effect for certain sorts of problems, including claimed HTTP User-Agents that are for old browser. Then several people reported that this had caused Feedly to start presenting my feed as the special 'your feed reader is (claiming to be) a too-old browser' single entry feed. The apparent direct cause of this is that Feedly made some syndication feed requests with HTTP User-Agent headers of old versions of Chrome and Firefox, which wound up getting a series of HTTP 302 temporary redirections to my new 'your feed reader is a too-old browser' stub feed. Feedly then decided to switch its main feed fetcher over to directly using this new URL for various feeds, despite the HTTP redirections being temporary (and not served for its main feed fetcher, which uses "Feedly/1.0" for its User-Agent).
Feedly has been making these fake browser User-Agent syndication feed fetch attempts for some time, and for some time they've been getting HTTP 302 redirections. However, up until late yesterday, what Feedly wound up on was a regular HTML web page. I have to assume that since this wasn't a valid syndication feed, Feedly ignored it. Only when I did the right thing to give syndication feed readers a good, useful error result did Feedly receive a valid syndication feed and go over the cliff.
Providing a stub syndication feed to communicate errors and problems to syndication feed fetchers is clearly the technically correct answer. However, I'm now somewhat less convinced that it's the most useful answer in practice. In practice, plenty of syndication feed fetchers keep fetching and re-fetching these stub feeds from me, suggesting that people either aren't seeing them or aren't doing anything about it. And now I've seen a feed reader malfunction spectacularly and in a harmful way because I gave it a valid syndication feed result at the end of a temporary HTTP redirection.
(I will probably stick to the current situation, partly because I no longer feel like accepting bad behavior from web agents.)
PS: If you're a feed fetching system, please give your feeds IDs that you put in the User-Agent, so that when they all wind up shifted to the same URL through some misfortune, the website involved can sort them out and redirect them back to the proper URLs.
Suppose, not hypothetically, that there are some feed readers (or at least things fetching your syndication feeds) that are misbehaving or blocked for one reason or another. You could just serve these feed readers HTTP 403 errors and stop there, but you'd like to be more friendly. For regular web browsers, you can either serve a custom HTTP error page that explains the situation or answer with a HTTP 302 temporary redirection to a regular HTML page with the explanation. Often the HTTP 302 redirection will be easier because you can use various regular means to create the HTML pages (and even host them elsewhere if you want). Unfortunately, this probably leaves syndication feed readers out in the cold.
(This can also come up if, for example, you decommission a syndication feed but want to let people know more about the situation than a simple HTTP 404 would give them.)
As far as I know, most syndication feed readers expect that the reply to their HTTP feed fetching request is in some syndication feed format (Atom, RSS, etc), which they will parse, process, and display to the person involved. If they get a reply in a different format, such as text/html, this is an error and it won't be shown to the person. Possible the HTML <title> element will make it through, or the HTTP status code response for an error, or maybe both. But your carefully written HTML error page is unlikely to be seen.
(Since syndication feed readers need to be able to display HTML in general, they could do something to show people at least the basic HTML text they got back. But I don't think this is very common.)
As a practical thing, if you want people using blocked syndication feed readers to have a chance to see your explanation, you need to reply with a syndication feed with an entry that is your (HTML) message to them (either directly or through HTTP 302 redirections). Creating this stub feed and properly serving it to appropriate visitors may be anywhere from annoying to challenging. Also, you can't reply with HTTP error statuses (and the feed) even though that's arguably the right thing to do. If you want syndication feed readers to process your stub feed, you need to provide it as part of a HTTP 200 reply.
(Speaking from personal experience I can say that hand-writing stub Atom syndication feeds is a pain, and it will drive you to put very little HTML in the result. Which is okay, you can make it mostly a link to your regular HTML page about whatever issue it is.)
If you're writing a syndication feed reader, I urge you to optionally display the HTML of any HTTP error response or regular HTML page that you receive. If I was writing some sort of blog system today, I would make it possible to automatically generate a syndication feed version of any special error page the software could serve to people (probably through some magic HTTP redirection). That way people can write each explanation only once and have it work in both contexts.
Today I ran across another article that talked in passing about "retained mode" versus "immediate mode" GUI toolkits (this one, via), and gave some code samples. As usual when I read about immediate mode GUIs and see source code, I had a pause of confusion because the code didn't feel right. That's because I keep confusing "immediate mode" as used here with a much older approach, which I will call repaint mode for lack of a better description.
A modern immediate mode system generally uses double buffering; one buffer is displayed while the entire window is re-drawn into the second buffer, and then the two buffers are flipped. I believe that modern retained mode systems also tend to use double buffering to avoid screen tearing and other issues (and I don't know if they can do partial updates or have to re-render the entire new buffer). In the old days, the idea of having two buffers for your program's window was a decided luxury. You might not even have one buffer and instead be drawing directly onto screen memory. I'll call this repaint mode, because you directly repainted some or all of your window any time you needed to change anything in it.
You could do an immediate mode GUI without double buffering, in this repaint mode, but it would typically be slow and look bad. So instead people devoted a significant amount of effort to not repainting everything but instead identifying what they were changing and repainting only it, along with any pixels from other elements of your window that had been 'damaged' from prior activity. If you did do a broader repaint, you (or the OS) typically set clipping regions so that you wouldn't actually touch pixels that didn't need to be changed.
(The OS's display system typically needed to support clipping regions in any situation where windows partially overlapped yours, because it couldn't let you write into their pixels.)
One reason that old display systems worked this way is that it required as little memory as possible, which was an important consideration back in the day (which was more or less the 1980s to the early to mid 1990s). People could optimize their repaint code to be efficient and do as little work as possible, but they couldn't materialize RAM that wasn't there. Today, RAM is relatively plentiful and we care a lot more about non-tearing, coherent updates.
The typical code style for a repaint mode system was that many UI elements would normally only issue drawing commands to update or repaint themselves when they were altered. If you had a slider or a text field and its value was updated as a result of input, the code would typically immediately call its repaint function, which could lead to a relatively tight coupling of input handling to the rendering code (a coupling that I believe Model-view-controller was designed to break). Your system had to be capable of a full window repaint, but if you wanted to look good, it wasn't a common operation. A corollary of this is that your code might spend a significant amount of effort working out what was the minimal amount of repainting you needed to do in order to correctly get between two states (and this code could be quite complicated).
(Some of the time this was hidden from you in widget and toolkit internals, although they didn't necessarily give you minimal repaints as you changed widget organization. Also, because a drawing operation was issued right away didn't mean that it took effect right away. In X, server side drawing operations might be batched up to be sent to the X server only when your program was about to wait for more X events.)
Because I'm used to this repaint mode style, modern immediate mode code often looks weird to me. There's no event handler connections, no repaint triggers, and so on, but there is an explicit display step. Alternately, you aren't merely configuring widgets and then camping out in the toolkit's main loop, letting it handle events and repaints for you (the widgets approach is the classical style for X applications, including PyTk applications such as pyhosts).
These days, I suspect that any modern toolkit that still looks like a repaint mode system is probably doing double buffering behind the scenes (unless you deliberately turn that off). Drawing directly to what's visible right now on screen is decidedly out of fashion because of issues like screen tearing, and it's not how modern display systems like Wayland want to operate. I don't know if toolkits implement this with a full repaint on the new buffer, or if they try to copy the old buffer to the new one and selectively repaint parts of it, but I suspect that the former works better with modern graphics hardware.
PS: My view is that even the widget toolkit version of repaint mode isn't a variation of retained mode because the philosophy was different. The widget toolkit might batch up operations and defer redoing layout and repainting things until you either returned to its event loop or asked it to update the display, but you expected a more or less direct coupling between your widget operations and repaints. But you can see it as a continuum that leads to retained mode when you decouple and abstract things enough.
(Now that I've written this down, perhaps I'll stop having that weird 'it's wrong somehow' reaction when I see immediate mode GUI code.)
For reasons outside of the scope of this entry, I want to test how various systemd memory resource limits work and interact with each other (which means that I'm really digging into cgroup v2 memory controls). When I started trying to do this, it turned out that I had no good test program (or programs), although I had some ones that gave me partial answers.
There are two complexities in memory usage testing programs in a cgroups environment. First, you may be able to allocate more memory than you can actually use, depending on your system's settings for strict overcommit. So it's not enough to see how much memory you can allocate using the mechanism of your choice (I tend to use mmap() rather than go through language allocators). After you've either determined how much memory you can allocate or allocated your target amount, you have to at least force the kernel to materialize your memory by writing something to every page of it. Since the kernel can probably swap out some amount of your memory, you may need to keep repeatedly reading all of it.
The second issue is that if you're not in strict overcommit (and sometimes even if you are), the kernel can let you allocate more memory than you can actually use and then you try to use it, hit you with the OOM killer. For my testing, I care about the actual usable amount of memory, not how much memory I can allocate, so I need to deal with this somehow (and this is where my current test programs are inadequate). Since the OOM killer can't be caught by a process (that's sort of the point), the simple approach is probably to have my test program progressively report on how much memory its touched so far, so I can see how far it got before it was OOM-killed. A more complex approach would be to do the testing in a child process with progress reports back to the parent so it could try to narrow in on how much it could use rather than me guessing that I wanted progress reports every, say, 16 MBytes or 32 MBytes of memory touching.
(Hopefully the OOM killer would only kill the child and not the parent, but with the OOM killer you can never be sure.)
I'm probably not the first person to have this sort of need, so I suspect that other people have written test programs and maybe even put them up somewhere. I don't expect to be able to find them in today's ambient Internet search noise, plus this is very close to the much more popular issue of testing your RAM memory.
(Will I put up my little test program when I hack it up? Probably not, it's too much work to do it properly, with actual documentation and so on. And these days I'm not very enthused about putting more repositories on Github, so I'd need to find some alternate place.)
The original Bill Joy vi famously only had a single level of undo (which is part of what makes it a product of its time). The 'u' command either undid your latest change or it redid the change, undo'ing your undo. When POSIX and the Single Unix Specification wrote vi into the standard, they required this behavior; the vi specification requires 'u' to work the same as it does in ex, where it is specified as:
Reverse the changes made by the last command that modified the contents of the edit buffer, including undo.
This is one particular piece of POSIX compliance that I think everyone should ignore.
Vim and its derivatives ignore the POSIX requirement and implement multi-level undo and redo in the usual and relatively obvious way. The vim 'u' command only undoes changes but it can undo lots of them, and to redo changes you use Ctrl-r ('r' and 'R' were already taken). Because 'u' (and Ctrl-r) are regular commands they can be used with counts, so you can undo the last 10 changes (or redo the last 10 undos). Vim can be set to vi compatible behavior if you want. I believe that vim's multi-level undo and redo is the default even when it's invoked as 'vi' in an unconfigured environment, but I can't fully test that.
Nvi has opted to remain POSIX compliant and operate in the traditional vi way, while still supporting multi-level undo. To get multi-level undo in nvi, you extend the first 'u' with '.' commands, so 'u..' undoes the most recent three changes. The 'u' command can be extended with '.' in either of its modes (undo'ing or redo'ing), so 'u..u..' is a no-op. The '.' operation doesn't appear to take a count in nvi, so there is no way to do multiple undos (or redos) in one action; you have to step through them by hand. I'm not sure how nvi reacts if you want do things like move your cursor position during an undo or redo sequence (my limited testing suggests that it can perturb the sequence, so that '.' now doesn't continue undoing or redoing the way vim will continue if you use 'u' or Ctrl-r again).
The vi emulation package evil
for GNU Emacs inherits GNU Emacs' multi-level undo and nominally
binds undo and redo to 'u' and Ctrl-r respectively. However, I don't
understand its actual stock undo behavior. It appears to do multi-level
undo if you enter a sequence of 'u' commands and accepts a count
for that, but it feels not vi or vim compatible if you intersperse
'u' commands with things like cursor movement, and I don't understand
redo at all (evil has some customization settings for undo behavior,
especially evil-undo-system).
I haven't investigated Evil extensively and this undo and redo stuff
makes me less likely to try using it in the future.
The BusyBox implementation of vi is minimal but it can be built with support for 'u' and multi-level undo, which is done by repeatedly invoking 'u'. It doesn't appear to have any redo support, which makes a certain amount of sense in an environment when your biggest concern may be reverting things so they're no worse than they started out. The Ubuntu and Fedora versions of busybox appear to be built this way, but your distance may vary on other Linuxes.
My personal view is that the vim undo and redo behavior is the best and most human friendly option. Undo and redo are predictable and you can predictably intersperse undo and redo operations with other operations that don't modify the buffer, such as moving the cursor, searching, and yanking portions of text. The nvi behavior essentially creates a special additional undo mode, where you have to remember that you're in a sequence of undo or redo operations and you can't necessarily do other vi operations in the middle (such as cursor movement, searches, or yanks). This matters a lot to me because I routinely use multi-level undo when I'm writing text to rewind my buffer to a previous state and yank out some wording that I've decided I like better than its replacement.
(For additional vi versions, on the Fediverse, I was also pointed to nextvi, which appears to use vim's approach to undo and redo; I believe neatvi also does this but I can't spot any obvious documentation on it. There are vi-inspired editors such as vile and vis, but they're not things people would normally use as a direct replacement for vi. I believe that vile follows the nvi approach of 'u.' while vis follows the vim model of 'uu' and Ctrl-r.)
I've been logging in to Unix machines for what is now quite a long time. When I started, it was traditional for your login process to be noisy. The login process itself would tell you last login details and the 'message of the day' ('motd'), and people often made their shell .profile or .login report more things, so you could see things like:
Last login: Tue Feb 10 22:16:14 2026 from 128.100.X.Y
 22:22:42 up 1 day, 11:22,  3 users,  load average: 0.40, 2.95, 3.30
cks cks cks
[output from fortune elided]
: <host> ;
(There is no motd shown here but it otherwise hits the typical high points, including a quote from fortune. People didn't always use 'fortune' itself but printing a randomly selected quote on login used to be common.)
Many years ago I modified my shell environment on our servers so that it wouldn't report
the currently logged in users, show the motd, or tell me my last
login. But I kept the 'uptime' line:
$ ssh cs.toronto.edu
 22:26:05 up 209 days,  5:26, 167 users,  load average: 0.47, 0.51, 0.60
: apps0.cs ;
Except, I typically didn't see that. I see this only on full login sessions, and when I was in the office I typically used special tools (also, also, also) that didn't actually start a login session and so didn't show me this greeting banner. Only when I was at home did I do SSH logins (with tooling) and so see this, and I didn't do that very much (because I didn't normally work from home, so I had no reason to be routinely opening windows on our servers).
As a long term result of that 2020 thing I work from home a lot more these days and so I open up a lot more SSH logins than I used to. Recently I was thinking about how to make this feel nicer, and it struck me that one of the things I found quietly annoying was that line from 'uptime' (to the point that sometimes my first action on login was to run 'clear', so I had a clean window). It was the one last thing cluttering up 'give me a new window on host X' and making the home experience visibly different from the office experience.
So far I've taken only a small step forward. I've made it so that I skip running 'uptime' if I'm logging in from home and the load on the machine I'm logging in to is sufficiently low to be uninteresting (which is often the case). As I get used to (or really, accept) this little change, I'll probably slowly move to silence 'uptime' more often.
When I think about it, making this change feels long overdue.
Printing out all sorts of things on login made sense in a world
where I logged in to places relatively infrequently. But that's not
the case in my world any more. My terminal windows are mostly
transient and I mostly work on servers that I
have to start new windows on, and right from very early I made my
office environment not treat them as login sessions, with the full
output and everything (if I cared about routinely seeing the load
on a server, that's what xload was for (cf)).
(I'm bad about admitting to myself that my usage has shifted and old settings no longer make sense.)
Baptiste Mispelon asked an interesting Python quiz (via, via @glyph):
Can someone explain this #Python import behavior?
I'm in a directory with 3 files:a.py contains `A = 1; from b import *`
b.py contains `from a import *; A += 1`
c.py contains `from a import A; print(A)`
Can you guess and explain what happens when you run `python c.py`?
I encourage you to guess which of the options in the original post is the actual behavior before you read the rest of this entry.
There are two things going on here. The first thing is what
actually happens when you do 'from module import ...'. The short version is that this copies
the current bindings of names from one module
to another. So when module b does 'from a import *', it copies
the binding of a.A to b.A and then the += changes that binding.
The behavior would be the same if we used 'from a import A' and
'from b import A' in the code, and if we did we could describe
what each did in isolation as starting with 'A = 1' (in a), then
'A = a.A; A += 2' (in b), and then 'A = b.A' (back in a)
successively (and then in c, 'A = a.A').
The second thing going on is that you can import incomplete modules
(this is true in both Python 2 and Python 3, which return the same
results here). To see how this works we need to combine the
description of 'import' and 'from'
and the approximation of what happens during loading a module, although
neither is completely precise. To summarize, when a module is being
loaded, the first thing that happens is that a module namespace is
created and is added to sys.modules; then the
code of the module is executed in that namespace. When Python
encounters a 'from', if there is an entry for the module in
sys.modules, Python immediately imports things from it; it
implicitly assumes that the module is already fully loaded.
At first I was surprised by this behavior, but the more I think
about it the more it seems a reasonable choice. It avoids having
to explicitly detect circular imports and it makes circular imports
work in the simple case (where you do 'import b' and then don't
use anything from b until all imports are finished and the program
is running). It has the cost that if you have circular name uses
you get an unhelpful error message about 'cannot import name' (or
'NameError: name ... is not defined' if you use 'from module
import *'):
$ cat a.py
from b import B; A = 10 + B
$ cat b.py
from a import A; B = 20 + A
$ cat c.py
from a import A; print(A)
$ python c.py
[...]
ImportError: cannot import name 'A' from 'a' [...]
(Python 3.13 does print a nice stack trace the points to the whole set of 'from ...' statements.)
Given all of this, here is what I believe is the sequence of execution in Baptiste Mispelon's example:
from a import A', which initiates a load of the 'a'
module.a' module is created and added to sys.modulesa.A' name (bound to 1) and then does 'from b import *'.b' module is created and added to sys.modules.from a import *', which finds that
'sys.modules["a"]' exists and copies the a.A name binding,
creating b.A (bound to 1).A += 1', which mutates the b.A binding (but not the
separate a.A binding) to be '2'.from b import *'. This import
copies all names (and their bindings) from sys.modules["b"] into
the 'a' module, which means the b.A binding (to 2) overwrites
the old a.A binding (to 1).from a import A'
can now complete by copying the a.A name and its binding into 'c',
make it the equivalent of 'import a; A = a.A; del a'.At the end of things, there is all of c.A, a.A, and b.A, and they are bindings to the same object. The order of binding was 'b.A = 2; a.A = b.A; c.A = a.A'.
(There's also a bonus question, where I have untested answers.)
Let's take a slightly different version of my error message example above, that simplifies things by leaving out c.py:
$ cat a.py
from b import B; A = 10 + B
$ cat b.py
from a import A; B = 20 + A
$ python a.py
[...]
ImportError: cannot import name 'B' from 'b' [...]
When I first did this I was quite puzzled until the penny dropped.
What's happening is that running 'python a.py' isn't creating
an 'a' module but instead a __main__ module, so b.py doesn't
find a sys.modules["a"] when it starts and instead creates one
and starts loading it. That second version of a.py, now in an "a"
module, is what tries to refer to b.B and finds it not there (yet).
I recently discovered a surprising path to accessing localhost URLs and services, where instead of connecting to 127.0.0.1 or the IPv6 equivalent, you connected to 0.0.0.0 (or the IPv6 equivalent). In that entry I mentioned that I didn't know if systemd's IPAddressDeny would block this. I've now tested this, and the answer is that systemd's restrictions do block this. If you set 'IPAddressDeny=localhost', the service or whatever is blocked from the 0.0.0.0 variation as well (for both outbound and inbound connections). This is exactly the way it should be, so you might wonder why I was uncertain and felt I needed to test it.
There are a variety of ways at different levels that you might implement access controls on a process (or a group of processes) in Linux, for IP addresses or anything else. For example, you might create an eBPF program that filtered the system calls and system call arguments allowed and attach it to a process and all of its children using seccomp(2). Alternately, for filtering IP connections specifically, you might use a cgroup socket address eBPF program (also), which are among the the cgroup program types that are available. Or perhaps you'd prefer to use a cgroup socket buffer program.
How a program such as systemd implements filtering has implications for what sort of things it has to consider and know about when doing the filtering. For example, if we reasonably conclude that the kernel will have mapped 0.0.0.0 to 127.0.0.1 by the time it invokes cgroup socket address eBPF programs, such a program doesn't need to have any special handling to block access to localhost by people using '0.0.0.0' as the target address to connect to. On the other hand, if you're filtering at the system call level, the kernel has almost certainly not done such mapping at the time it invokes you, so your connect() filter had better know that '0.0.0.0' is equivalent to 127.0.0.1 and it should block both.
This diversity is why I felt I couldn't be completely sure about systemd's behavior without actually testing it. To be honest, I didn't know what the specific options were until I researched them for this entry. I knew systemd used eBPF for IPAddressDeny (because it mentions that in the manual page in passing), but I vaguely knew there are a lot of ways and places to use eBPF and I didn't know if systemd's way needed to know about 0.0.0.0 or if systemd did know.
As I found out through use of 'bpftool cgroup list /sys/fs/cgroup/<relevant thing>' on a systemd service that I knew uses systemd IP address filtering, systemd uses cgroup socket buffer programs, and is presumably looking for good and bad IP addresses and netblocks in those programs. This unfortunately means that it would be hard for systemd to have different filtering for inbound connections as opposed to outgoing connections, because at the socket buffer level it's all packets.
(You'd have to go up a level to more complicated filters on socket address operations.)
Recently I saw another discussion of how some people are very attached to the original, classical vi and its behaviors (cf). I'm quite sympathetic to this view, since I too am very attached to the idiosyncratic behavior of various programs I've gotten used to (such as xterm's very specific behavior in various areas), but at the same time I had a hot take over on the Fediverse:
Hot take: basic vim (without plugins) is mostly what vi should have been in the first place, and much of the differences between vi and vim are improvements. Multi-level undo and redo in an obvious way? Windows for easier multi-file, cross-file operations? Yes please, sign me up.
Basic vi is a product of its time, namely the early 1980s, and the rather limited Unix machines of the time (yes a VAX 11/780 was limited).
(The touches of vim superintelligence, not so much, and I turn them off.)
For me, vim is a combination of genuine improvements in vi's core editing behavior (cf), frustrating (to me) bits of trying too hard to be smart (which I mostly disable when I run across them), and an extension mechanism I ignore but people use to make vim into a superintelligent editor with things like LSP integrations.
Some of the improvements and additions to vi's core editing may be things that Bill Joy either didn't think of or didn't think were important enough. However, I feel strongly that some or even many of omitted features and differences are a product of the limited environments vi had to operate in. The poster child for this is vi's support of only a single level of undo, which drastically constrains the potential memory requirements (and implementation complexity) of undo, especially since a single editing operation in vi can make sweeping changes across a large file (consider a whole-file ':...s/../../' substitution, for example).
(The lack of split windows might be one part memory limitations and one part that splitting an 80 by 24 serial terminal screen is much less useful than splitting, say, an 80 by 50 terminal window.)
Vim isn't the only improved version of vi that has added features like multi-level undo and split windows so you can see multiple files at once (or several parts of the same file); there's also at least nvi. I'm used to vim so I'm biased, but I happen to think that a lot of vim's choices for things like multi-level undo are good ones, ones that will be relatively obvious and natural to new people and avoid various sorts of errors and accidents. But other people like nvi and I'm not going to say they're wrong.
I do feel strongly that giving stock vi to anyone who doesn't specifically ask for it is doing them a disservice, and this includes installing stock vi as 'vi' on new Unix installs. At this point, what new people are introduced to and what is the default on systems should be something better and less limited than stock vi. Time has moved on and Unix systems should move on with it.
(I have similar feelings about the default shell for new accounts for people, as opposed to system accounts. Giving people bare Bourne shell is not doing them any favours and is not likely to make a good first impression. I don't care what you give them but it should at least support cursor editing, file completion, and history, and those should be on by default.)
PS: I have complicated feelings about Unixes that install stock vi as 'vi' and something else under its full name, because on the one hand that sounds okay but on the other hand there is so much stuff out there that says to use 'vi' because that's the one name that's universal. And if you then make 'vi' the name of the default (visual) editor, well, it certainly feels like you're steering new people into it and doing them a disservice.
(I don't expect to change the mind of any Unix that is still shipping stock vi as 'vi'. They've made their cultural decisions a long time ago and they're likely happy with the results.)
Over on the Fediverse, I mentioned that we once missed noticing that there had been a power failure. Naturally there is a story there (and this is the expanded version of what I said in the Fediverse thread). A necessary disclaimer is that this was all some time ago and I may be mangling or mis-remembering some of the details.
My department is spread across multiple buildings, one of which has my group's offices and our ancient machine room (which I believe has been there since the building burned down and was rebuilt). But for various reasons, this building doesn't have any of the department's larger meeting rooms. Once upon a time we had a weekly meeting of all the system administrators (and our manager), both my group and all of the Points of Contact, which amounted to a dozen people or so and needed one of the larger meeting rooms, which was of course in a different building than our machine room.
As I was sitting in the meeting room during one weekly meeting, fiddling around, I tried to get my Linux laptop on either our wireless network or our wired laptop network (it's been long enough that I can't remember which). This was back in the days when networking on Linux laptops wasn't a 100% reliable thing, especially wireless, so I initially assumed that my inability to get on the network was the fault of my laptop and its software. Only after a bit of time and also failing on both wired and wireless networking did I ask to see if anyone else (with a more trustworthy laptop) could get on the network. As a ripple of "no, not me" spread around the room, we realized that something was wrong.
(This was in the days before smartphones were pervasive, and also it must have been before the university-wide wireless network was available in that meeting room.)
What was wrong turned out to be a short power failure that had been isolated to the building that our machine room was in. Had people been in their offices, the problem would have been immediately obvious; we'd have seen all networking fail, and the people in the building would have seen the lights go out and so on. But because the power issue hit at exactly the time that we were all in our weekly meeting in a different building, we missed it.
(My memory is that by the time we'd reached the machine room the power was coming back, but obviously we had a variety of work to do to clean the situation up so that was it for the meeting.)
For extra irony, the building we were meeting in was right next to our machine room's building, and the meeting room had a window that literally looked across the alleyway at our building. At least that made it quick and easy to get to the machine room, because we could just walk across the bridge that connects the two buildings.
PS: In our environment, this is such a rare collection of factors that it's not worth trying to set up some sort of alerting for it, especially today in a world with pervasive smartphones (where people outside the meeting room can easily send some of us messages, even with the network down).
(Also, these days we don't normally have such big meetings any more and if we did, they'd be virtual meetings and we'd definitely notice bits of the network going down, one way or another.)
One of the classic challenges in web security is DNS rebinding. The simple version is that you put some web service on localhost in order to keep outside people from accessing it, and then some joker out in the world makes 'evil.example.org' resolve to 127.0.0.1 and arranges to get you to make requests to it. Sometimes this is through JavaScript in a browser, and sometimes this is by getting you to fetch things from URLs they supply (because you're running a service that fetches and processes things from external URLs, for example).
One way people defend against this is by screening out 127.0.0.0/8, IPv6's ::1, and other dangerous areas of IP address space from DNS results (either in the DNS resolver or in your own code). And you can also block URLs with these as explicit IP addresses, or 'localhost' or the like. Sometimes you might add extra security restrictions to a process or an environment through means like Linux eBPF to screen out which IP addresses you're allowed to connect to (cf, and I don't know whether systemd's restrictions would block this).
As I discovered the other day, if you connect to INADDR_ANY, you connect to localhost (which any number of people already knew). Then in a comment Kevin Lyda reminded me that INADDR_ANY is also known as 0.0.0.0, and '0' is often accepted as a name that will turn into it, resulting in 'ssh 0' working and also (in some browsers) 'http://0:<port>/'. The IPv6 version of INADDR_ANY is also an all-zero address, and '::0' and '::' are both accepted as names for it, and then of course it's easy to create DNS records that resolve to either the IPv4 or IPv6 versions. As I said on the Fediverse:
Surprise: blocking DNS rebinding to localhost requires screening out more than 127/8 and ::1 answers. This is my face.
It turns out that this came up in mid 2024 in the browser context, as '0.0.0.0 Day' (cf). Modern versions of Chrome and Safari apparently explicitly block requests to 0.0.0.0 (and presumably also the IPv6 version), while Firefox will still accept it. And of course your URL-fetching libraries will almost certainly also accept it, especially through DNS lookups of ordinary looking but attacker controlled hostnames.
In my view, it's not particularly anyone's fault that this slipped through the cracks, both in browsers and in tools that handle fetching content from potentially hostile URLs. The reality of life is that how IP behaves in practice is complicated and some of it is historical practice that's been carried forward and isn't necessarily obvious or well known (and certainly isn't standardized). Then URLs build on top of this somewhat rickety foundation and surprises happen.
(This is related to the issue of browsers being willing to talk to 'local' IPs, which Chrome once attempted to start blocking (and I believe that shipped, but I don't use Chrome any more so I don't know what the current state is).)
An interesting change to IP behavior landed in FreeBSD 15, as I discovered by accident. To quote from the general networking section of the FreeBSD 15 release notes:
Making a connection to
INADDR_ANY, i.e., using it as an alias forlocalhost, is now disabled by default. This functionality can be re-enabled by setting thenet.inet.ip.connect_inaddr_wild sysctlto 1. cd240957d7ba
The change's commit message has a bit of a different description:
Previously connect() or sendto() to INADDR_ANY reached some socket bound to some host interface address. Although this was intentional it was an artifact of a different era, and is not desirable now.
This is connected to an earlier change and FreeBSD bugzilla #28075, which has some additional background and motivation for the overall change (as well as the history of this feature in 4.x BSD).
The (current) Linux default behavior matches the previous FreeBSD behavior. If you had something listening on localhost (in IPv4, specifically 127.0.0.1) or listening on INADDR_ANY, connecting to INADDR_ANY would reach it and give the source of your connection a localhost address (either 127.0.0.1 or ::1 depending on IPv4 versus IPv6). Obviously the current FreeBSD default behavior has now changed, and the Linux behavior may change at some point (or at least become something that can be changed by a sysctl).
(Linux specifically restricts you to connecting to 127.0.0.1; you can't reach a port listening on, eg, 127.0.0.10, although that is also a localhost address.)
One of the tricky API issues here is that higher level APIs can often be persuaded or tricked into using INADDR_ANY by default when they connect to something. For example, in Go's net package, if you leave the hostname blank, you currently get INADDR_ANY (which is convenient behavior for listening but not necessarily for connecting). In other APIs, your address variable may start with an initial zero value for the target IP address, which is INADDR_ANY for IPv4; if your code never sets it (perhaps because the 'host' is a blank string), you get a connection to INADDR_ANY and thus to localhost. In top of that, a blank host name to connect to may have come about through accident or through an attacker's action (perhaps they can make decoding or parsing the host name fail, leaving the 'host name' blank on you).
I believe that what's happening with Go's tests is that the net package guarantees that things like net.Dial("tcp", ":<port>") connect to localhost, so of course the net package has tests to insure that this stays working. Currently, Go's net package implements this behavior by mapping a blank host to INADDR_ANY, which has traditionally worked and been the easiest way to get the behavior Go wants. It also means that Go can use uniform parsing of 'host:port' for both listening, where ':port' is required to mean listening on INADDR_ANY, and for connecting, where the host has to be localhost. Since this is a high level API, Go can change how the mapping works, and it pretty much has to in order to fully work as documented on FreeBSD 15 in a stock configuration.
(Because that would be a big change to land right before the release of Go 1.26, I suspect that the first bugfix that will land is to skip these tests on FreeBSD, or maybe only on FreeBSD 15+ if that's easy to detect.)
There are a variety of ways to pass secrets from one program to another on Unix, and many of them may expose your secrets under some circumstances. A secret passed on the command line is visible in process listings; a secret passed in the environment can be found in the process's environment (which can usually be inspected by outside parties). When I've had to deal with this in administrative programs in our environment, I have reached for an old Unix standby: pass the secret between programs through file descriptors, specifically standard input and standard output. This can even be used and done in shell scripts. However, there are obviously some cautions, both in general and in shell scripts.
Although Bourne shell script variables look like environment
variables, they aren't exported into the environment until you ask
for this with 'export'. Naturally you should never do this for
the environment variables that hold secrets. Also, these days 'echo'
is a built-in in any version of the Bourne shell you want to use,
so 'echo $somesecret' does not actually run a process that has
the secret visible in its command line arguments. However, you have
to be careful what commands you use here, because potentially
convenient ones like printf aren't builtin and
can't be used like this.
As a general caution, you need to either limit the characters that are allowed in secrets or encode the secret somehow (you might as well use base64). If you need to pass more than one thing between your programs this way, you'll need to define a very tiny protocol, if only so that you write down the order that things are sent between programs (and if they are, for example, newline-delimited).
One advantage of passing secrets this way is that it's easy to pass them from machine to machine through mechanisms like SSH (if you have passwordless SSH). Instead of 'provide-secret | consume-secret', you can simply change to 'provide-secret | ssh remote consume-secret'.
In the right (Unix) environment it's possible to pass secrets this way to programs that want to read them from a file, using features like Bash's '<(...)' notation or the underlying Unix features that enable that Bash feature (specifically, /dev/fd).
Passing secrets between programs this way can seem a little janky and improper, but I can testify that it works. We have a number of things that move secrets around this way, including across machines, and they've been doing it for years without problems.
(There are fancy ways to handle this on Linux for some sorts of secrets, generally static secrets, but I don't know of any other generally usable way of doing this for dynamic secrets that are generated on the fly, especially if some of the secrets consumers are shell scripts. But you probably could write a D-Bus based system to do this with all sorts of bells and whistles, if you had to do it a lot and wanted something more professional looking.)
UEFI is the modern firmware standard for x86 PCs and other systems; sometimes the actual implementation is called a UEFI BIOS, but the whole area is a bit confusing. I recently wrote about getting FreeBSD to use a serial console on a UEFI system and mentioned that some UEFI BIOSes could echo console output to a serial port, which caused Greg A. Woods to ask a good question in a comment:
So, how does one get a typical UEFI-supporting system to use a serial console right from the firmware?
The mechanical answer is that you go into your UEFI BIOS settings and see if it has any options for what is usually called 'console redirection'. If you have it, you can turn it on and at that point the UEFI console will include the serial device you picked, theoretically allowing both output and input from the serial device. This is very similar to the 'console redirection' option in 'legacy' pre-UEFI BIOSes, although it's implemented rather differently. An important note here is that UEFI BIOS console redirection only applies to things using the UEFI console. Your UEFI BIOS definitely uses the UEFI console, and your UEFI operating system boot loader hopefully does. Your operating system almost certainly doesn't.
A UEFI BIOS doesn't need to have such an option and typical desktop ones probably don't. The UEFI standard provides a standard set of ways to implement console redirection (and alternate console devices in general), but UEFI doesn't require it; it's perfectly standard compliant for a UEFI BIOS to only support the video console. Even if your UEFI BIOS provides console redirection, your actual experience of trying to use it may vary. Watching boot output is likely to be fine, but trying to interact with the BIOS from your serial port may be annoying.
How all of this works is that UEFI has a notion of an EFI console,
which is (to quote the documentation) "used to handle input and
output of text-based information intended for the system user during
the operation of code in the boot services environment". The EFI
console is an abstract thing, and it's also some globally defined
variables
that include ConIn and ConOut, the device paths
of the console input and output device or devices. Device paths can
include multiple sub-devices (in generic device path structures),
and one of the examples specifically mentioned is:
[...] An example of this would be the
ConsoleOutenvironment variable that consists of both a VGA console and serial output console. This variable would describe a console output stream that is sent to both VGA and serial concurrently and thus has a Device Path that contains two complete Device Paths. [...]
(Sometimes this is 'ConsoleIn' and 'ConsoleOut', eg, and sometimes 'ConIn' and 'ConOut'. Don't ask me why.)
In theory, a UEFI BIOS can hook a wide variety of things up to ConIn, ConOut, or both, as it decides (and implements), possibly including things like IPv4 connections. In practice it's up to the UEFI BIOS to decide what it will bother to support. Server UEFI BIOSes will typically support serial console redirection, which is to say connecting some serial port to ConIn and ConOut in addition to the VGA console. Desktop motherboard UEFI BIOSes probably won't. I don't know if there are very many server UEFI BIOSes that will use only the serial console and exclude the VGA console from ConIn and ConOut.
(Also in theory I believe a UEFI BIOS could wire up ConOut to include a serial port but not connect it to ConIn. In practice I don't know of any that do.)
EFI also defines a protocol (a set of function calls) for console input and output. For input, what people (including the UEFI BIOS itself) get back is either or both of an EFI scan code or a Unicode character. The 'EFI scan code' is used to determine what special key you typed, for example F11 to go into some UEFI BIOS setup mode. The UEFI standard also has an appendix with examples of mapping various sorts of input to these EFI scan codes, which is very relevant for entering anything special over a serial console.
If you look at this appendix B, you'll note that it has entries for both 'ANSI X3.64 / DEC VT200-500 (8-bit mode)' and 'VT100+ (7-bit mode)'. Now you have two UEFI BIOS questions. First, does your UEFI BIOS even implement this, or does it either ignore the whole issue (leaving you with no way to enter special characters) or come up with its own answers? And second, does your BIOS restrict what it recognizes over the serial port to just whatever type it's set the serial port to, or will it recognize either sequence for something like F11? The latter question is very relevant because your terminal emulator environment may or may not generate what your UEFI BIOS wants for special keys like F11 (or it may even intercept some keys, like F11; ideally you can turn this off).
(Another question is what your UEFI BIOS may call the option that controls what serial port key mapping it's using. One machine I've tested on calls the setting "Putty KeyPad" and the correct value for the "ANSI X3.64" version is "XTERMR6", for example, which corresponds to what xterm, Gnome-Terminal and probably other modern terminal programs send.)
Another practical issue is that if you do anything fancy with a UEFI serial console, such as go into the BIOS configuration screens, your UEFI BIOS may generate output that assumes a very specific and unusual terminal resolution. For instance, the Supermicro server I've been using for my FreeBSD testing appears to require a 100x30 terminal in its BIOS configuration screens; if you have any other resolution you get various sorts of jumbled results. Many of our Dell servers take a different approach, where the moment you turn on serial console redirection they choke their BIOS configuration screens down to an ASCII 80x24 environment. OS boot environments may be more forgiving in various ways.
The good news is that your operating system's bootloader will probably limit itself to regular characters, and in practice what you care about a lot of the time is interacting with the bootloader (for example, for alternate boot and disaster recovery), not your UEFI BIOS.
As FreeBSD discusses in loader.efi(8), it's not necessarily straightforward for an operating system boot loader to decode what the UEFI ConIn and ConOut are connected to in order to pass the information to the operating system (which normally won't be using UEFI to talk to its console(s)). This means that the UEFI BIOS console(s) may not wind up being what the OS console(s) are, and you may have to configure them separately.
PS: As you may be able to tell from what I've written here, if you care significantly about UEFI BIOS access from the serial port, you should expect to do a bunch of experimentation with your specific hardware. Remember to re-check your results with new server generations and new UEFI BIOS firmware versions.
As covered recently, the normal way to check simple services from outside in a Prometheus environment is with Prometheus Blackbox, which is somewhat complicated to understand. One of its abstractions is a prober, a generic way of checking some service using HTTP, DNS queries, a TCP connection, and so on. The TCP prober supports conducting a query-response dialog once you connect, but currently (as of Blackbox 0.28.0) it doesn't directly expose metrics that tell you where your TCP probe with a query-response set failed (and why), and sometimes you'd like to know.
A somewhat typical query-response probe looks like this:
  smtp_starttls:
    prober: tcp
    tcp:
      query_response:
        - expect: "^220"
        - send: "EHLO something\r"
        - expect: "^250-STARTTLS"
        - expect: "^250 "
        - send: "STARTTLS\r"
        - expect: "^220"
        - starttls: true
        - expect: "^220"
        - send: "QUIT\r"
To understand what metrics we can look for on failure, we need to both understand how each important option in a step can fail, and what metrics they either set on failure or create when they succeed.
starttls will fail if it can't successfully negotiate a TLS connection
with the server, possibly including if the server's TLS certificate fails
to verify. It sets no metrics on failure, but on success it will set
various TLS related metrics such as the probe_ssl_* family and
probe_tls_version_info.
send will fail if there is an error sending the line, such as the TCP
connection closing on you. It sets no metrics on either success or failure.
expect reads lines from the TCP connection until either a line
matches your regular expression, it hits EOF, or it hits a network
error. If it hit a network error, including from the other end
abruptly terminating the connection in a way that raises a local
error, it sets no metrics. If it hit EOF, it sets the metric
probe_failed_due_to_regex to 1; if it matched a line, it sets
that metric to 0.One important case of 'network error' is if the check you're doing times out. This is internally implemented partly by putting a (Go) deadline on the TCP connection, which will cause an error if it runs too long. Typical Blackbox module timeouts aren't very long (how long depends on both configuration settings and how frequent your checks are; they have to be shorter than the check interval).
If you have multiple 'expect' steps and you check fails at one
of them, there's (currently) no way to find out which one it failed
at unless you can determine this from other metrics, for example
the presence or absence of TLS metrics.
expect_bytes fails if it doesn't immediately read those bytes
from the TCP connection. If it failed because of an error or because
it read fewer bytes than required (including no bytes, ie an EOF), it
sets no metrics. If it read enough bytes it sets the
probe_failed_due_to_bytes metric to either 0 (if they matched)
or 1 (if they didn't).In many protocols, the consequences of how expect works means
that if the server at the other end spits out some error response
instead of the response you expect, your expect will skip over
it and then wait endlessly. For instance, if the SMTP server you're
probing gives you a SMTP 4xx temporary failure response in either
its greeting banner or its reply to your EHLO, your 'expect' will
sit there trying to read another line that might start with '220'.
Eventually either your check will time out or the SMTP server will,
and probably it will be your check (resulting in a 'network error'
that leaves no traces in metrics).
Generally this means you can only see a probe_failed_due_to_regex
of 1 in a TCP probe based module if the other end cleanly closed
the connection, so that you saw EOF. This tends to be pretty rare.
(We mostly see it for SSH probes against overloaded machines, where
we connect but then the SSH daemon immediately closes the connection
without sending the banner, giving us an EOF in our 'expect' for
the banner.)
If the probe failed because of a DNS resolution failure, I believe
that probe_ip_addr_hash will be 0 and I think probe_ip_protocol
will also be 0.
If the check involves TLS, the presence of the TLS metrics in the result means that you got a connection and got as far as starting TLS. In the example above, this would mean that you got almost all of the way to the end.
I'm not sure if there's any good way to detect that the connection
attempt failed. You might be able to reasonably guess that from an
abnormally low probe_duration_seconds value. If you know the
relevant timeout values, you can detect a probe that failed due to
timeout by looking for a suitably high probe_duration_seconds
value.
If you have some use of the special labels action, then the presence of a
probe_expect_info metric means that the check got to that step.
If you don't have any particular information that you want to capture
from an expect line, you can use labels (once) to mark that
you've succeeded at some expect step by using a constant value
for your label.
(Hopefully all of this will improve at some point and Blackbox will
provide, for example, a metric that tells you the step number that
a query-response block failed on. See issue #1528, and
also issue #1527 where
I wish for a way to make an 'expect' fail immediately and
definitely if it receives known error responses, such as a SMTP
4xx code.)
One of the important roles of Linux system package managers like dpkg and RPM is providing a single interface to building programs from source even though the programs may use a wide assortment of build processes. One of the source building features that both dpkg and RPM included (I believe from the start) is patching the upstream source code, as well as providing additional files along with it. My impression is that today this is considered much less important in package managers, and some may make it at least somewhat awkward to patch the source release on the fly. Recently I realized that there may be a reason for this potential oddity in dpkg and RPM.
Both dpkg and RPM are very old (by Linux standards). As covered in Andrew Nesbitt's Package Manager Timeline, both date from the mid-1990s (dpkg in January 1994, RPM in September 1995). Linux itself was quite new at the time and the Unix world was still dominated by commercial Unixes (partly because the march of x86 PCs was only just starting). As a result, Linux was a minority target for a lot of general Unix free software (although obviously not for Linux specific software). I suspect that this was compounded by limitations in early Linux libc, where apparently it had some issues with standards (see eg this, also, also, also).
As a minority target, I suspect that Linux regularly had problems compiling upstream software, and for various reasons not all upstreams were interested in fixing (or changing) that (especially if it involved accepting patches to cope with a non standards compliant environment; one reply was to tell Linux to get standards compliant). This probably left early Linux distributions regularly patching software in order to make it build on (their) Linux, leading to first class support for patching upstream source code in early package managers.
(I don't know for sure because at that time I wasn't using Linux or x86 PCs, and I might have been vaguely in the incorrect 'Linux isn't Unix' camp. My first Linux came somewhat later.)
These days things have changed drastically. Linux is much more standards compliant and of course it's a major platform. Free software that works on non-Linux Unixes but doesn't build cleanly on Linux is a rarity, so it's much easier to imagine (or have) a package manager that is focused on building upstream source code unaltered and where patching is uncommon and not as easy (or trivial) as dpkg and RPM make it.
(You still need to be able to patch upstream releases to handle security patches and so on, since projects don't necessarily publish new releases for them. I believe some projects simply issue patches and tell you to apply them to their current release. And you may have to backport a patch yourself if you're sticking on an older release of the project that they no longer do patches for.)
Over on the Fediverse I said:
Today's other work achievement: getting a UEFI booted FreeBSD 15 machine to use a serial console on its second serial port, not its first one. Why? Because the BMC's Serial over Lan stuff appears to be hardwired to the second serial port, and life is too short to wire up physical serial cables to test servers.
The basics of serial console support for your FreeBSD machine are
covered in the loader.conf manual page,
under the 'console' setting (in the 'Default Settings' section).
But between UEFI and FreeBSD's various consoles, things get
complicated, and for me the manual pages didn't do a great job of
putting the pieces together clearly. So I'll start with my descriptions
of all of the loader.conf variables that are relevant:
console="efi,comconsole"
boot_multicons="YES"
comconsole_speed="115200"
comconsole_port="0x2f8"
hw.uart.console="io:0x2f8,br:115200" console=' setting or because you're being redundant.
See loader.efi(8) (and
then loader_simp(8) and uart(4)).(That the loader does this even without a 'comconsole' in your nonexistent 'console=' line may some day be considered a bug and fixed.)
If they agree with each other, you can safely set both hw.uart.console and the comconsole_* variables.
On a system where the UEFI BIOS isn't echoing the UEFI console output to a serial port, the basic version of FreeBSD using both the video console (settings for which are in vt(4)) and the serial console (on the default of COM1), with the primary being the video console, is a loader.conf setting of:
console="efi,comconsole" boot_multicons="YES"
This will change both the bootloader console and the kernel console after boot. If your UEFI BIOS is already echoing 'console' output to the serial port, bootloader output will be doubled and you'll get to see fun bootloader output like:
LLooaaddiinngg ccoonnffiigguurreedd mmoodduulleess......
If you see this (or already know that your UEFI BIOS is doing this), the minimal alternate loader.conf settings (for COM1) are:
# for COM1 / ttyu0
hw.uart.console="io:0x3f8,br:115200"
(The details are covered in loader.efi(8)'s discussion of console considerations.)
If you don't need a 'console=' setting because of your UEFI BIOS,
you must set either hw.uart.console or the comconsole_*
settings. Technically, setting hw.uart.console is the correct
approach; that setting only comconsole_* still works may be a
bug.
If you don't explicitly set a serial port to use, FreeBSD will use
COM1 (ttyu0, Linux ttyS0) for the bootloader and kernel. This is
only possible if you're using 'console=', because otherwise you
have to directly or indirectly set 'hw.uart.console', which directly
tells the kernel which serial port to use (and the bootloader will
use whatever UEFI tells it to). To change the serial port to COM2,
you need to set the appropriate one of 'comconsole_port' and
'hw.uart.console' from 0x3f8 (COM1) to the right PC port value
of 0x2f8.
So our more or less final COM2 /boot/loader.conf for a case where you can turn off or ignore the BIOS echoing to the serial console is:
console="efi,comconsole"
boot_multicons="YES"
comconsole_speed="115200"
# For the COM2 case
comconsole_port="0x2f8"
If your UEFI BIOS is already echoing 'console' output to the serial port, the minimal version of the above (again for COM2) is:
# For the COM2 case
hw.uart.console="io:0x2f8,br:115200"
(As with Linux, the FreeBSD kernel will only use one serial port as the serial console; you can't send kernel messages to two serial ports. FreeBSD at least makes this explicit in its settings.)
As covered in conscontrol and elsewhere,
FreeBSD has a high level console, represented by /dev/console,
and a low level console, used directly by the kernel for things
like kernel messages. The high level console can only go to one
device, normally the first one; this is either the first one in
your 'console=' line or whatever UEFI considers the primary
console. The low level console can go to multiple devices. Unlike
Linux, this can be changed on the fly once the system is up through
conscontrol (and also have its state checked).
Conveniently, you don't need to do anything to start a serial login
on your chosen console serial port. All four possible (PC) serial
ports, /dev/ttyu0 through /dev/ttyu3, come pre-set in /etc/ttys
with 'onifconsole' (and 'secure'), so that if the kernel is using
one of them, there's a getty started on it. I haven't tested what
happens if you use conscontrol to change the console on the
fly.
Booting FreeBSD on a UEFI based system is covered through the manual page series of uefi(8), boot(8), loader.efi(8), and loader(8). It's not clear to me if loader.efi is the EFI specific version of loader(8), or if the one loads and starts the other in a multi-stage boot process. I suspect it's the former.
Here's what I think is a generic commented block for serial console support:
# Uncomment if the UEFI BIOS does not echo to serial port
#console="efi,comconsole"
boot_multicons="YES"
comconsole_speed="115200"
# Uncomment for COM2
#comconsole_port="0x2f8"
# change 0x3f8 (COM1) to 0x2f8 for COM2
hw.uart.console="io:0x3f8,br:115200"
All of this works for me on FreeBSD 15, but your distance may vary.
One of the things going on right now is that Python is doing a Python developer survey. On the Fediverse, I follow a number of people who do Python stuff, and they've been posting about various aspects of the survey, including a section on what tools people use for what. This gave me an interesting although very brief look into a world that I'm deliberately ignoring, and I'm doing that because I feel my needs are very simple and are well met by basic, essentially universal tools that I already know and have.
Although I do some small amount of Python programming, I'm not a
Python developer; you could call me a consumer of Python things,
both programs and packages. The thing I do most is use programs
written in Python that aren't single-file, dependency free things,
almost always for my own personal use (for example, asncounter and the Python language server). The tool I use
for almost all of these is pipx, which I feel
handles pretty much everything I could ask for and comes pre-packaged
in most Linuxes. Admittedly I've written some tools to make my
life nicer.
(One important think pipx does is install each program separately. This allows me to remove one clearly and also to use PyPy or CPython as I prefer on a program by program basis.)
For programs that we want to use as part of our operations (for example), the modern, convenient approach is to make a venv and then install the program into it with pip. Pip is functionally universal and the resulting venvs effectively function as self contained artifacts that can be moved or put anywhere (provided that we stick to the same Ubuntu LTS version). So far we haven't tried to upgrade these in place; if a new version of the program comes out, we build a new venv and swap which one is used.
(It's possible that package dependencies of the program could be updated even if it hasn't released a new version, but we treat these built venvs as if they were compiled binaries; once produced, they're not modified.)
Finally, our Django based web application now uses a Django setup where Django is installed into a venv and then the production tree of our application lives outside that venv (previously we didn't use venvs at all but that stopped working). Our application isn't versioned or built into a Python artifact; it's a VCS tree and is managed through VCS operations. The Django venv is created separately, and I use pip for that because again pip is universal and familiar. This is a crude and brute force approach but it's also ensured that I haven't had to care about the Python packaging ecosystem (and how to make Python packages) for the past fifteen years. At the moment we use only standard Django without any third party packages that we'd also have to add to the venv and manage, and I expect that we're going to stay that way. A third party package would have to be very attractive (or become extremely necessary) in order for us to take it on and complicate life.
I'm broadly aware that there are a bunch of new Python package management and handling tools that go well beyond pip and pipx in both performance and features. My feeling so far is that I don't need anything more than I have and I don't do the sort of regular Python development where the extra features the newer tools have would make a meaningful difference. And to be honest, I'm wary of some or all of these turning out to be a flavour of the month. My mostly outside impression is that Python packaging and package management has had a great deal of churn over the years, and from seeing the Go ecosystem go through similar things from closer up I know that being stuck with a now abandoned tool is not particularly fun. Pip and pipx aren't the modern hot thing but they're also very unlikely to go away.
Yesterday I discussed the two sorts of program package managers, system package managers that manage the whole system and application package managers that mostly or entirely manage third party programs. Commercial Unix got application package managers in the very early 1990s, but Linux's first program managers were system package managers, in dpkg and RPM (or at least those seem to be the first Linux package managers).
The abstract way to describe why is to say that Linux distributions had to assemble a whole thing from separate pieces; the kernel came from one place, libc from another, coreutils from a third, and so on. The concrete version is to think about what problems you'd have without a package manager. Suppose that you assembled a directory tree of all of the source code of the kernel, libc, coreutils, GCC, and so on. Now you need to build all of these things (or rebuild, let's ignore bootstrapping for the moment).
Building everything is complicated partly because everything goes about it differently. The kernel has its own configuration and build system, a variety of things use autoconf but not necessarily with the same set of options to control things like features, GCC has a multi-stage build process, Perl has its own configuration and bootstrapping process, X is frankly weird and vaguely terrifying, and so on. Then not everyone uses 'make install' to actually install their software, so you have another set of variations for all of this.
(The less said about the build processes for either TeX or GNU Emacs in the early to mid 1990s, the better.)
If you do this at any scale, you need to keep track of all of this information (cf) and you want a uniform interface for 'turn this piece into a compiled and ready to unpack blob'. That is, you want a source package (which encapsulates all of the 'how to do it' knowledge) and a command that takes a source package and does a build with it. Once you're building things that you can turn into blobs, it's simpler to always ship a new version of the blob whenever you change anything.
(You want the 'install' part of 'build and install' to result in a blob rather than directly installing things on your running system because until it finishes, you're not entirely sure the build and install has fully worked. Also, this gives you an easy way to split overall system up into multiple pieces, some of which people don't have to install. And in the very early days, to split them across multiple floppy disks, as SLS did.)
Now you almost have a system package manager with source packages and binary packages. You're building all of the pieces of your Linux distribution in a standard way from something that looks a lot like source packages, and you pretty much want to create binary blobs from them rather than dump everything into a filesystem. People will obviously want a command that takes a binary blob and 'installs' it by unpacking it on their system (and possibly extra stuff), rather than having to run 'tar whatever' all the time themselves, and they'll also want to automatically keep track of which of your packages they've installed rather than having to keep their own records. Now you have all of the essential parts of a system package manager.
(Both dpkg and RPM also keep track of which package installed what files, which is important for upgrading and removing packages, along with things having versions.)
I've written before that one of the complications of talking about package managers and package management is that there are two common types of package managers, program managers (which manage installed programs on a system level) and module managers (which manage package dependencies for your project within a language ecosystem or maybe a broader ecosystem). Today I realized that there is a further important division within program managers. I will call this division application (package) managers and system (package) managers.
A system package manager is what almost all Linux distributions have (in the form of Debian's dpkg and its set of higher level tools, Fedora's RPM and its set of higher level tools, Arch's pacman, and so on). It manages everything installed by the distribution on the system, from the kernel all the way up to the programs that people run to get work done, but certainly including what we think of as system components like the core C library, basic POSIX utilities, and so on. In modern usage, all updates to the system are done by shipping new package versions, rather than by trying to ship 'patches' that consist of only a few changed files or programs.
(Some Linux distributions are moving some high level programs like Chrome to an application package manager.)
An application package manager doesn't manage the base operating system; instead it only installs, manages, and updates additional (and optional) software components. Sometimes these are actual applications, but at other times, especially historically, these were things like the extra-cost C compiler from your commercial Unix vendor. On Unix, files from these application packages were almost always installed outside of the core system areas like /usr/bin; instead they might go into /opt/<something> or /usr/local or various other things.
(Sometimes vendor software comes with its own internal application package manager, because the vendor wants to ship it in pieces and let you install only some of them while managing the result. And if you want to stretch things a bit, browsers have their own internal 'application package management' for addons.)
A system package manager can also be used for 'applications' and routinely is; many Linux systems provide undeniable applications like Firefox and LibreOffice through the system package manager (not all of them, though). This can include third party packages that put themselves in non-system places like /opt (on Unix) if they want to. I think this is most common on Linux systems, where there's no common dedicated application package manager that's widely used, so third parties wind up building their own packages for the system package manager (which is sure to be there).
For relatively obvious reasons, it's very hard to have multiple system package managers in use on the same system at once; they wind up fighting over who owns what and who changes what in the operating system. It's relatively straightforward to have multiple application package managers in use at once, provided that they keep to their own area so that they aren't overwriting each other.
For the most part, the *BSDs have taken a base system plus application manager approach, with things like their 'ports' system being their application manager. Where people use third party program managers, including pkgsrc on multiple Unixes, Homebrew on macOS, and so on, these are almost always application managers that don't try to also take over and manage the core ('base') operating system programs, libraries, and so on.
(As a result, the *BSDs ship system updates as 'patches', not as new packages, cf OpenBSD's syspatch. I've heard some rumblings that FreeBSD may be working to change this.)
I believe that Microsoft Windows has some degree of system package management, in that it has components that you might or might not install and that can be updated or restored independently, but I don't have much exposure to the Windows world. I will let macOS people speak up in the comments about how that system operates (as people using macOS experience, not as how it's developed; as developed there are a bunch of different parts to macOS, as one can see from the various open source repositories that Apple publishes).
PS: The Linux flatpak movement is mostly or entirely an application manager, and so usually separate from the system package manager (Snap is the same thing but I ignore Canonical's not-invented-here pet projects as much as possible). You can also see containers as an extremely overweight application 'package' delivery model.
PPS: In my view, to count as package management a system needs to have multiple 'packages' and have some idea of what packages are installed. It's common but not absolutely required for the package manager to keep track of what files belong to what package. Generally this goes along with a way to install and remove packages. A system can be divided up into components without having package management, for example if there's no real tracking of what components you've installed and they're shipped as archives that all get unpacked in the same hierarchy with their files jumbled together.
Recently I saw a Go example that made me scratch my head and decode what was going on (you can see it here). Here's what I understand about what's going on. Suppose that you want to create a general interface for a generic type that requires any concrete implementation to be a pointer type. We can do this by literally requiring a pointer:
type Pointer[P any] interface {
   *P
}
That this is allowed is not entirely obvious from the specification,
but it's not forbidden. We're not allowed to use just 'P' or
'~P' in the interface type, because you're not allowed to directly
or indirectly embed yourself as a type parameter, but '*P' isn't
doing that directly; instead, it's forcing a pointer version of
some underlying type. Actually using it is a bit awkward, but I'll
get to that.
We can then require such a generic type to have some methods, for example:
type Index[P any] interface {
   New() *P
   *P
}
This can be implemented by, for example:
type base struct {
	i int
}

func (b *base) New() *base {
	return &base{-1}
}
But suppose we want to have a derived generic type, for example a
struct containing an Index field of this Index (generic) type.
We'd like to write this in the straightforward way:
type Example[P any] struct {
	Index Index[P]
}
This doesn't work (at least not today); you can't write 'Index[P]'
outside of a type constraint. In order to make this work you must
create the type with two related generic type constraints:
type Example[T Index[P], P any] struct {
	Index T
}
This unfortunately means that when we use this generic type to construct values of some concrete type, we have to repeat ourselves:
e := Example[*base, base]{&base{0}}
However, requiring both type constraints means that we can write generic methods that use both of them:
func (e *Example[T, P]) Do() {
	e.Index = (T)(new(P))
}
I believe that the P type would otherwise be inaccessible and you'd be unable to construct this, but I could be wrong; these are somewhat deep waters in Go generics.
You run into a similar issue with functions that you simply want to take an argument that is a Pointer (or an Index), because our Pointer (and Index) generic types are specified relative to an underlying type and can't be used without specifying that underlying type, either explicitly or through type inference. So you have to write generic functions that look like:
func Something[T Pointer[P], P any] (p T) {
   [...]
}
This generic function can successfully use type inference when
invoked, but it has to be declared this way and if type inference
doesn't work in your specific case you'll need to repeat yourself,
as with constructing Example values.
Looking into all of this and writing it out has left me less enlightened than I hoped at the start of the process, but Go generics are a complicated thing in general (or at least I find all of their implications and dark corners to be complicated).
(Original source and background, which is slightly different from what I've done here.)
In the computer science tradition, we can add a layer of indirection.
func NewExample[T Index[P], P any] (p *P) Example[T,P] {
    var e Example[T,P]
    e.Index = p
    return e
}
Then you can call this as 'NewExample(&base{0})' and type inference
will fill in al of the types, at least in this case. Of course this
isn't an in-place construction, which might be important in some
situations.
The original version was like this:
type Index[P any, T any] interface {
	New() T
	*P
}

type Example[T Index[P, T], P any] struct {
	Index T
}
In this version, Example has a type parameter that refers to
itself, 'T Index[P, T]'. This is legal in a type parameter
declaration;
what would be illegal is referring to 'Example' in the type
parameters. It's also satisfiable (which isn't guaranteed).
We have a collection of VPN servers, some OpenVPN based and some L2TP based. They used to be based on OpenBSD, but we're moving from OpenBSD to FreeBSD and the VPN servers recently moved too. We also have a system for collecting Prometheus metrics on VPN usage, which worked by parsing the output of things. For OpenVPN, our scripts just kept working when we switched to FreeBSD because the two OSes use basically the same OpenVPN setup. This was not the case for our L2TP VPN server.
OpenBSD does L2TP using npppd, which supports a handy command line control program, npppctl, that can readily extract and report status information. On FreeBSD, we wound up using mpd5. Unfortunately, mpd5 has no equivalent of npppctl. Instead, as covered (sort of) in its user manual you get your choice of a TCP based console that's clearly intended for interactive use and a web interface that is also sort of intended for interactive use (and isn't all that well documented).
Fortunately, one convenient thing about the web interface is that it uses HTTP Basic authentication, which means that you can easily talk to it through tools like curl. To do status scraping through the web interface, first you need to turn it on and then you need an unprivileged mpd5 user you'll use for this:
set web self 127.0.0.1 5006
set web open

set user metrics <some-password> user
At this point you can use curl to get responses from the mpd5
web server (from the local host, ie your VPN server itself):
curl -s -u metrics:... --basic 'http://localhost:5006/<something>'
There are two useful things you can ask the web server interface for. First, you can ask it for a complete dump of its status in JSON format, by asking for 'http://localhost:5006/json' (although the documentation claims that the information returned is what 'show summary' in the console would give you, it is more than that). If you understand mpd5 and like parsing and processing JSON, this is probably a good option. We did not opt to do this.
The other option is that you can ask the web interface to run console
(interface) commands for you, and then give you the output in either
a 'pleasant' HTML page or in a basic plain text version. This is
done by requesting either '/cmd?<command>' or '/bincmd?<command>'
respectively. For statistics scraping, the most useful version is
the 'bincmd' one, and the command we used is 'show session':
curl -s -u metrics:... --basic 'http://localhost:5006/bincmd?show%20session'
This gets you output that looks like:
ng1  172.29.X.Y  B2-2 9375347-B2-2  L2-2  2  9375347-L2-2  someuser  A.B.C.D
RESULT: 0
(I assume 'RESULT: 0' would be something else if there was some sort of problem.)
Of these, the useful fields for us are the first, which gives the local network device, the second, which gives the internal VPN IP of this connection, and the last two, which give us the VPN user and their remote IP. The others are internal MPD things that we (hopefully) don't have to care about. The internal VPN IP isn't necessary for (our) metrics but may be useful for log correlation.
To get traffic volume information, you need to extract the usage
information from each local network device that a L2TP session is
using (ie, 'ng1' and its friends). As far as I know, the only tool
for this in (base) FreeBSD is netstat. Although you can
invoke it interface by interface, probably the better thing to do
(and what we did) is to use 'netstat -ibn -f link' to dump
everything at once and then pick through the output to get the lines
that give you packet and byte counts for each L2TP interface, such
as ng1 here.
(I'm not sure if dropped packets is relevant for these interfaces;
if you think it might be, you want 'netstat -ibnd -f link'.)
FreeBSD has a general system, 'libxo', for producing output from many commands in a variety of handy formats. As covered in xo_options, this can be used to get this netstat output in JSON if you find that more convenient. I opted to get the plain text format and use field numbers for the information I wanted for our VPN traffic metrics.
(Partly this was because I could ultimately reuse a lot of my metrics generation tools from the OpenBSD npppctl parsing. Both environments generated two sets of line and field based information, so a significant amount of the work was merely shuffling around which field was used for what.)
PS: Because of how mpd5 behaves, my view is that you don't want to let anyone but system staff log on to the server where you're using it. It is an old C code base and I would not trust it if people can hammer on its TCP console or its web server. I certainly wouldn't expose the web server to a non-localhost network, even apart from the bit where it definitely doesn't support HTTPS.
Recently, Verisimilitude left a comment on my entry on X11's DirectColor visual type, where they mentioned that L Peter Deutsch, the author of Ghostscript, lamented using twenty-four bit colour for Ghostscript rather than a more flexible approach, which you may need in printing things with colour. As it happens, I know a bit about this area for two or three reasons, which come at it from different angles. A long time ago I was peripherally involved in desktop publishing software, which obviously cares about printing colour, and then later I became a hobby photographer and at one point had some exposure to people who care about printing photographs (both colour and black and white).
(The actual PDF format supports much more complex colour models than basic 24-bit sRGB or sGray colour, but apparently Ghostscript turns all of that into 24-bit colour internally. See eg, which suggests that modern Ghostscript has evolved into a more complex internal colour model.)
On the surface, printing colour things out in physical media may seem simple. You convert RGB colour to CMYK colour and then send the result off to the printer, where your inkjet or laser printer uses its CMYK ink or toner to put the result on the paper. Photographic printers provide the first and lesser complication in this model, because serious photographic printers have many more colours of ink than CMYK and they put these inks on various different types of fine art paper that have different effects on how the resulting colours come out.
Photographic printers have so many ink colours because this results in more accurate and faithful colours or, for black and white photographs (where a set of grey inks may be used), in more accurate and faithful greys. Photographers who care about this will carefully profile their printer using its inks on the particular fine art paper they're going to use in order to determine how RGB colours can be most faithfully reproduced. Then as part of the printing process, the photographic print software and the printer driver will cooperate to take the RGB photograph and map its colours to what combination of inks and ink intensity can best do the job.
(Photographers use different fine art papers because the papers have different characteristics; one of the high level ones is matte versus glossy papers. But the rabbit hole of detailed paper differences goes quite deep. So does the issue of how many inks a photo printer should have and what they should be. Naturally photographers who make prints have lots of opinions on this whole area.)
Where this stops being just a print driver issue is that people editing photographs often want to see roughly how they'll look when printed out without actually making a print (which is generally moderately expensive). This requires the print subsystem to be capable of feeding colour mapping results back to the editing layer, so you can see that certain things need to be different at the RGB colour level so that they come out well in the printed photograph. This is of course all an approximation, but at the very least photo editing software like darktable wants to be able to warn you when you're creating an 'out of gamut' colour that can't be accurately printed.
(I don't have any current numbers for the cost of making prints on photographic printers, but it's not trivial, especially if you're making large prints; you'll use a decent amount of ink and the fine art paper isn't cheap either. You don't want to make more test prints than you really have to.)
All of this is still in the realm of RGB colour, though (although colour space and display profiling and management complicate the picture). To go beyond this we need to venture into the twin worlds of printing advertising, including product boxes, and fine art printing. Printed product ads and especially boxes for products not infrequently use spot colours, where part of the box will be printed with a pure ink colour rather than approximated with process colours (CMYK or other). You don't really want to manage spot colours by saying that they're a specific RGB value and then everything with that RGB value will be printed with that spot colour; ideally you want to manage them as a specific spot colour layer for each spot colour you're using. An additional complication is that product boxes for mass products aren't necessarily printed with CMYK inks at all; like photographic prints, they may use a custom ink set that's designed to do a good job with the limited colour gamut that appears on the product box.
(This leads to a fun little game you can play at home.)
Desktop publishing software that wants to do a good job with this needs a bunch of features. I believe that generally you want to handle spot colours as separate editing layers even if they're represented in RGB. You probably also want features to limit the colour space and colours that the product designer can do, because the company that will print your boxes may have told you it has certain standard ink sets and please keep your box colours to things they handle well as much as possible. Or you may want to use only pure spot colours from your set of them and not have a product designer accidentally set something to another colour.
Printing art books of fine art has similar issues. The artwork that you're trying to reproduce in the art book may use paint colours that don't reproduce well in standard CMYK colours, or in any colour set without special inks (one case is metallic colours, which are readily available for fine art paints and which some artists love). The artist whose work you're trying to print may have strong opinions about you doing a good job of it, while the more inks you use (and the more special inks) the more expensive the book will be. Some compromise is inevitable but you have to figure out where and what things will be the most mangled by various ink set options. This means your software should be able to map from something roughly like RGB scans or photographs into ink sets and let you know about where things are going to go badly.
For fine art books, my memory is that there are a variety of tricks that you can play to increase the number of inks you can use. For example, sometimes you can print different sections of the book with different inks. This requires careful grouping of the pages (and artwork) that will be printed on a single large sheet of paper with a single set of inks at the printing plant. It also means that your publishing software needs to track ink sets separately for groups of pages and understand how the printing process will group pages together, so it can warn you if you're putting an artwork onto a page that clashes with the ink set it needs.
(Not all art books run into these issues. I believe that a lot of art books for Japanese anime have relatively few problems here because the art they're reproducing was already made for an environment with a restricted colour gamut. No one animates with true metallic colours for all sorts of reasons.)
To come back to PDFs and colour representation, we can see why you might regret picking a single 24-bit RGB colour representation for everything in a program that handles things that will eventually be printed. I'm not sure there's any reasonable general format that will cover everything you need when doing colour printing, but you certainly might want to include explicit provisions for spot colours (which are very common in product boxes, ads, and so on), and apparently Ghostscript eventually gained support for them (as well as various other colour related things).
Prometheus Blackbox is somewhat complicated to understand. One of its fundamental abstractions is a 'prober', a generic way of probing some service (such as making HTTP requests or DNS requests). One prober is the 'tcp' prober, which makes a TCP connection and then potentially conducts a conversation with the service to verify its health. For example, here's a ClamAV daemon health check, which connects, sends a line with "PING", and expects to receive "PONG":
  clamd_pingpong:
    prober: tcp
    tcp:
      query_response:
        - send: "PING\n"
        - expect: "PONG"
The conversation with the service is detailed in the query_response
configuration block (in YAML). For a long time I thought that this
was what it looks like here, a series of entries with one directive
per entry, such as 'send', 'expect', or 'starttls' (to switch to
TLS after, for example, you send a 'STARTTLS' command to the SMTP
or IMAP server).
However, much like an earlier case with Alertmanager, this is not actually what the YAML syntax is.
In reality each step in the query_response YAML array can have
multiple things. To quote the documentation:
 [ - [ [ expect: <string> ],
       [ expect_bytes: <string> ],
       [ labels:
         - [ name: <string>
             value: <string>
           ], ...
       ],
       [ send: <string> ],
       [ starttls: <boolean | default = false> ]
     ], ...
 ]
When there are multiple keys in a single step, Blackbox handles
them in almost the order listed here: first expect, then labels
if the expect matched, then expect_bytes, then send, then
starttls. Normally you wouldn't have both expect and expect_bytes
in the same step (and combining them is tricky). This order is not
currently documented, so you have to read prober/query_response.go
to determine it.
One reason to combine expect and send together in a single step
is that then send can use regular expression match groups from
the expect in its text. There's an example of this in the example
blackbox.yml file:
  irc_banner:
    prober: tcp
    tcp:
      query_response:
      - send: "NICK prober"
      - send: "USER prober prober prober :prober"
      - expect: "PING :([^ ]+)"
        # cks: note use of ${1}, from PING
        send: "PONG ${1}"
      - expect: "^:[^ ]+ 001"
The 'labels:' key is something added in v0.26.0, in #1284. As shown in the example blackbox.yml file, it can be used to do things like extract SSH banner information into labels on a metric:
  ssh_banner_extract:
    prober: tcp
    timeout: 5s
    tcp:
      query_response:
      - expect: "^SSH-2.0-([^ -]+)(?: (.*))?$"
        labels:
        - name: ssh_version
          value: "${1}"
        - name: ssh_comments
          value: "${2}"
This creates a metric that looks like this:
probe_expect_info {ssh_comments="Ubuntu-3ubuntu13.14", ssh_version="OpenSSH_9.6p1"} 1
At the moment there are some undocumented restrictions on the
'labels' key (or action or whatever you want to call it). First,
it only works if you use it in a step that has an 'expect'. Even
if all you want to do is set constant label values (for example to
record that you made it to a certain point in your steps), you need
to expect something; you can't use 'labels' in a step that
otherwise only has, say, 'send'. Second, you can only have one
labels in your entire query_response section; if you have
more than one, you'll currently experience a Go panic when checking
reaches the second.
This is unfortunate because Blackbox is currently lacking good
ways to see how far your query_response steps got if the probe
fails.
Sometimes it's obvious where your probe failed, or irrelevant, but
sometimes it's both relevant and not obvious. If you could use multiple labels,
you could progressively set fixed labels and tell how far you got
by what labels were visible in the scrape metrics.
(And of course you could also record various pieces of useful information that you don't get all at once.)
expect and send togetherMy personal view is that I normally don't want to condense 'expect'
and 'send' together into one step entry unless I have to, because
most of the time it inverts the relationship between the two. In
most protocols and protocol interactions, you send something and
expect a response; you don't receive something and then send a
response to it. In my opinion this is more naturally written in the
style:
      query_response:
      - expect: "something"
      - send: "my request"
      - expect: "reply to my request"
      - send: "something else"
      - expect: "reply to something else"
Than as:
      query_response:
      - expect: "something"
        send: "my request"
      - expect: "reply to my request"
        send: "something else"
      - expect: "reply to something else"
What look like pairs (an expect/send in the same step) are not actually pairs; the 'expect' is for a previous 'send' and then 'send' pairs with the next 'expect' in the next step. So it's clearer to write them all as separate steps, which doesn't create any expectations of pairing.
The news of the day is that Microsoft had a significant outage inside their Microsoft 365 infrastructure. We noticed when we stopped being able to deliver email to the university's institutional email system, which was a bit mysterious in the usual way of today's Internet:
The joys of modern email: "Has Microsoft decided to put all of our email on hold or are they having a global M365 inbound SMTP email incident?"
(For about the last hour and a half, if it's an incident someone is having a bad day.)
We didn't find out immediately when this happened (and if our systems had been working right, we wouldn't have found out when I did, but that's another story). Initially I was going to write an entry about whether or not we should use our monitoring system to monitor external services that other people run, but it turns out that we do try to monitor whether we can do a SMTP conversation to the university's M365-hosted institutional email. There were several things that happened with this monitoring.
The first thing that happened is that the alerts related to it rotted. The university once had a fixed set of on-premise MX targets and we monitored our ability to talk to them and alerted on it. Then the university moved their MX targets to M365 and our old alerts stopped applying, so we commented them out and never added any new alerts for any new checking we were doing.
One of the reasons for that is that we were doing this monitoring through Prometheus Blackbox, and Blackbox is not ideal for monitoring Microsoft 365 MX targets. The way M365 does redundancy in their inbound mail servers for your domain is not by returning multiple DNS MX records, but by returning one MX record for a hostname that has multiple IP addresses (and the IP addresses may change). What a mailer will do is try all of the IP addresses until one responds. What Blackbox does is it picks one IP address and then it probes the IP address; if the address fails, there is no attempt to check the other IP addresses. Failing if one IP of many is not responding is okay for casual checks, but you don't necessarily want to alert on it.
(I believe that Blackbox picks the first IP address in the DNS A record, but this depends on how the Go standard library and possibly your local resolver behaves. If either sort the results, you get the first A record in the sorted result.)
The final issue is that we weren't necessarily checking enough of the SMTP conversation. For various reasons, we decided that all we could safely and confidently check was that the university's mail system accepted a testing SMTP MAIL FROM from our subdomain; we didn't check that it also accepted a SMTP RCPT TO. I believe that during part of this Microsoft 365 incident, the inbound M365 SMTP servers would accept our SMTP MAIL FROM but report an error at the RCPT TO (although I can't be sure). Certainly if we want to have a more realistic check of 'is email to M365 working', we should go as far as a SMTP RCPT TO.
(During parts of the incident, DNS lookups didn't succeed for the MX target. Without detailed examination I can't be sure of what happened in the other cases.)
Overall, Blackbox is probably the wrong tool to check an external mail target like M365 if we're serious about it and want to do a good job. At the moment it's not clear to me if we should go to the effort to do better, since it is an external service and there's nothing we can do about problems (although we can let people know, which has some value, but that's another entry).
PS: You can get quite elaborate in a mail deliverability test, but to some degree the more elaborate you get the more pieces of infrastructure you're testing, and you may want a narrow test for better diagnostics.
Recently I read Understanding ZFS Scrubs and Data Integrity (via), which is a perfectly good article and completely accurate, bearing in mind some qualifications which I'm about to get into. One of the things this article says in the preface is:
In this article, we will walk through what scrubs do, how the Merkle tree layout lets ZFS validate metadata and data from end to end, [...]
This is both completely correct and misleading, because what ZFS people mean we talk about "metadata" is probably not what ordinary people (who are aware of filesystems) think of as "metadata". This misunderstanding leads people (which once upon a time included me) to believe that ZFS scrubs check much more than they actually do.
Specifically, in normal use "ZFS metadata" is different from "filesystem metadata", like directories. A core ZFS concept is DMU objects (dnodes), which are a basic primitive of ZFS's structure; a DMU object stores data in a more or less generic way. As covered in more detail in my broad overview on how ZFS is structured on disk, filesystem objects like directories, files, ACLs, and so on are all DMU objects that are stored in the filesystem's (DMU) object set and are referred to (for examine in filesystem directories) by object number (the equivalent of an inode number). At this level, filesystem metadata is ZFS data.
What ZFS people and ZFS scrubs mean by "ZFS metadata" are things such as each filesystem's DMU object set (which is itself a DMU object, because in ZFS it's turtles most of the way down), the various DSL (Dataset and Snapshot Layer) objects, the various DMU objects used to track and manage free space in the ZFS pool, and so on. All of this ZFS metadata is organized in a tree that's rooted in the uberblock and the pool's Meta Object Set (MOS) that the uberblock points to. It is this tree that is guarded and verified by checksums and ZFS scrubs, from the very top down to the leaves.
As far as I know, all filesystem level files, directories, symbolic links, ACLs, and so on are leaves of this tree of ZFS metadata; they are merely ZFS data. While they make up a logical filesystem tree (we hope), they aren't a tree at the level of ZFS objects; they're merely DMU objects in the filesystem's object set. Only at the ZFS filesystem layer (ZPL, the "ZFS POSIX Layer") does ZFS look inside these various filesystem objects and maintain structural relationships, such as a filesystem's directory tree or parent information (some of which is maintained using generic ZFS facilities like ZAP objects).
Scrubs must go through the tree of ZFS metadata in order to find everything that's in use in order to verify its checksum, but they don't have to go through the filesystem's directory tree. To verify the checksum of everything in a filesystem, all a scrub has to do is go through the filesystem's DMU object set, which contains every in-use object in the filesystem regardless of whether it's a regular file, a directory, a symbolic link, an ACL, or whatever.
The news of the time interval is that Linux's usual telnetd has had a giant security vulnerability for a decade. As people on the Fediverse observed, we've been here before; Solaris apparently had a similar bug 20 or so years ago (which was CVE-2007-0882, cf, via), and AIX in the mid 1990s (CVE-1999-0113, source, also)), and also apparently SGI Irix, and no doubt many others (eg). It's not necessarily telnetd at fault, either, as I believe it's sometimes been rlogind.
All of these bugs have a simple underlying cause; in a way that
root cause is people using Unix correctly and according to its
virtue of modularity, where each program does one thing and you
string programs together to achieve your goal. Telnetd and rlogind
have the already complicated job of talking a protocol to the
network, setting up ptys, and so on, so obviously they should leave
the also complex job of logging the user in to login, which already
exists to do that. In theory this should work fine.
The problem with this is that from more or less the beginning, login has had several versions of its job. From no later than V3 in 1972, login could also be used to switch from one user to another, not just log in initially. In 4.2 BSD, login was modified and reused to become part of rlogind's authentication mechanism (really; .rhosts is checked in the 4.2BSD login.c, not in rlogind). Later, various versions of login were modified to support 'automatic' logins, without challenging for a password (see eg FreeBSD login(1), OpenBSD login(1), and Linux login(1); use of -f for this appears to date back to around 4.3 Tahoe). Sometimes this was explicitly for the use of things that were running as root and had already authenticated the login.
In theory this is all perfectly Unixy. In practice, login figured out which of these variations of its basic job it was being used for based on a combination of command line arguments and what UID it was running as, which made it absolutely critical that programs running as root that reused login never allowed login to be invoked with arguments that would shift it to a different mode than they expected. Telnetd and rlogind have traditionally run as root, creating this exposure.
People are fallible, programmers included, and attackers are very ingenious. Over the years any number of people have found any number of ways to trick network daemons running as root into running login with 'bad' arguments.
The one daemon I don't think has ever been tricked this way is OpenSSH, because from very early on sshd refused to delegate logging people in to login. Instead, sshd has its own code to log people in to the system. This has had its complexities but has also shielded sshd from all of these (login) context problems.
In my view, this is one of the unfortunate times when the ideals
of Unix run up against the uncomfortable realities of the world.
Network daemons delegating logging people in to login is the
correct Unix answer, but in practice it has repeatedly gone wrong
and the best answer is OpenSSH's.
One of the surprises of TCP and UDP is that when your program listens for incoming TCP connections or UDP packets, you can chose to listen only on a specific IP address instead of all of the IP addresses that the current system has. This behavior started as a de-facto standard but is now explicitly required for TCP in RFC 9293 section 3.9.1.1. There are at least two uses of this feature; to restrict access to your listening daemon, and to run multiple daemons on the same port.
The classical case of restricting access to a listening daemon is a program that listens only on the loopback IP address (IPv4 or IPv6 or both). Since loopback addresses can't be reached from outside the machine, only programs running on the machine can reach the daemon. On a machine with multiple IP addresses that are accessible from different network areas, you can also listen on only one IP address (perhaps an address 'inside' a firewall) to shield your daemon from undesired connections.
(Except in the case of the loopback IP address, this shielding isn't necessarily perfect. People on any of your local networks can always throw packets at you for any of your IP addresses, if they know them. In some situations, listening only on RFC 1918 private addresses can be reasonably safe from the outside world.)
The other use is to run multiple daemons that are listening on the same port but on different IP addresses. For example, you might run a public authoritative DNS server for some zones that is listening on port 53 (TCP and UDP) on your non-localhost IPs and a private resolving DNS server that is listening on localhost:53. Or you could have a 'honeypot' IP address that is running a special SSH server to look for Internet attackers, while still running your regular SSH server (to allow regular access) on your normal IP addresses. Broadly, this can be useful any time you want to have different configurations on the same port for different IP addresses.
Using restricted listening for access control has a lot of substitutes. Your daemon can check incoming connections and drop them depending on the local or remote IPs, or your host could have some simple firewall rules, or some additional software layer could give you a hand. Also, as mentioned, if you listen on anything other than localhost, you need to be sure that your overall configuration makes that safe enough. The other options are more complex but also more sure, or at least more obviously sure (or flawed).
Using restricted listening to have different things listening on the same TCP or UDP port doesn't have any good substitutes in current systems. Even if the operating system allows multiple things to listen generally on the same port, it has no idea which instance should get which connection or packet. To do this steering today, you'd need either a central 'director' daemon that received all packets or connection attempts and then somehow passed them to the right other program, or you'd have programs listen on different ports and then use OS firewall rules to (re)direct traffic to the right instance.
You can imagine an API that allows all of the programs to tell the operating system which connections they're interested in and which ones they aren't. One simple form of that API is 'listen on a specific IP address instead of all of them', and it conveniently also allows the OS to trivially detect conflicts between programs (even if some of them initially seem artificial).
(It would be nice if OSes gave programs nice APIs for choosing what incoming connections and packets they wanted and what they didn't, but mostly we deal with the APIs we have, not the ones we want.)
Modern single sign on specifications such as OIDC and SAML and systems built on top of them are fairly complex things with a lot of moving parts. It's possible to have a somewhat simple surface appearance for using them in web servers, but the actual behind the scenes implementation is typically complicated, and of course you need an identity provider server and its supporting environment as well (which can get complicated). One reaction to this is to suggest using X.509 certificates to authenticate people (as a recent comment on this entry did).
There are a variety of technical considerations here, like to what extent browsers (and other software) might support personal X.509 certificates and make them easy to use, but to my mind there's also an overriding broad consideration that makes the two significantly different. Namely, people can remember passwords but they have to store X.509 certificates. OIDC and SAML may pass around tokens and programs dealing with them may store tokens, but the root of everything is in passwords, and you can recover all the tokens from there. This is not true with X.509 certificates; the certificate is the thing.
(There are also challenges around issuing, managing, checking, and revoking personal X.509 certificates, but let's ignore them.)
To make using X.509 certificate practical for authenticating people, people have to be able to use them on multiple devices and move them between browsers. Many people have multiple devices and people do change what browsers they use (for all that browser and platform vendors like them not to, or at least the ones that are currently popular are often all for that). Today, there is basically nothing that helps people deal with this, and as a result X.509 certificates are at best awkward for people to use (and remember, security is people).
(In common use, it's easy to move passwords between browsers and devices because they're in your head (excluding password managers, which are still not used by a lot of people).)
Of course you could develop standards and software for moving and managing X.509 certificates. In many ways, passkeys show what's possible here, and also show many of the hazards of using things for authentication that can't be memorized (or copied) by people in order to transport them between environments. However, no such standards and software exist today, and no one has every shown much interest in developing them, even back in the days when personal X.509 certificates were close to your only game in town.
(You could also develop much better browser UIs for dealing with personal X.509 certificates, something that was extremely under-developed back in the days when they were sometimes in use. Even importing such a certificate into your browser could be awkward, never mind using it.)
In the past, people have authenticated web applications through the use of personal X.509 certificates (as a more secure form of passwords). As far as I know, pretty much everyone has given up on that and moved to better options, first passwords (sometimes plus some form of additional confirmation) and then these days trying to get people to use passkeys. One reason they gave up was that actually using X.509 certificates in practice was awkward and something that people found quite annoying.
(I had to use a personal X.509 certificate for a while in order to get free TLS certificates for our servers. It wasn't a particularly great experience and I'm not in the least bit surprised that everyone ditched it for single sign on systems.)
PS: It's no good saying that X.509 certificates would be great if all of the required technology was magically developed, because that's not going to just happen. If you want personal X.509 certificates to be a thing, you have a great deal of work ahead of you and there is no guarantee you'll be successful. No one else is going to do that work for you.
PPS: You can imagine a system where people use their passwords and other multi-factor authentication to issue themselves new personal X.509 certificates signed by your local Certificate Authority, so they can recover from losing the X.509 certificate blob (or get a new certificate for a new device). Congratulations, you have just re-invented a manual version of OIDC tokens (also, it's worse in various ways).
Sometimes, people in technology believe that we can solve problems by getting people to pay attention. This comes up in security, anti-virus efforts, anti-phish efforts, monitoring and alert handling, warning messages emitted by programs, warning messages emitted by compilers and interpreters, and many other specific contexts. We are basically always wrong.
One of the core, foundational results from human factors research, research into human vision, the psychology of perceptions, and other related fields, is that human brains are a mess of heuristics and have far more limited capabilities than we think (and they lie to us all the time). Anyone who takes up photography as a hobby has probably experienced this (I certainly did); you can take plenty of photographs where you literally didn't notice some element in the picture at the time but only saw it after the fact while reviewing the photograph.
(In general photography is a great education on how much our visual system lies to us. For example, daytime shadows are blue, not black.)
One of the things we have a great deal of evidence about from both experiments and practical experience is that people (which is to say, human brains) are extremely bad at noticing changes in boring, routine things. If something we see all the time quietly disappears or is a bit different, the odds are extremely high that people will literally not notice. Our minds have long since registered whatever it is as 'routine' and tuned it out in favour of paying attention to more important things. You cannot get people to pay attention to these routine, almost always basically the same thing by asking them to (or yelling at them to do so, or blaming them when they don't), because our minds don't work that way.
We also have a tendency to see what we expect to see and not see what we don't expect to see, unless what we don't expect shoves itself into our awareness with unusual forcefulness. There is a famous invisible gorilla experiment that shows one aspect of this, but there are many others. This is why practical warning, alerts, and so on cannot be unobtrusive. Fire alarms are blaringly loud and obtrusive so that you cannot possibly miss them despite not expecting to hear them. A fire alarm that was "pay attention to this light if it starts blinking and makes a pleasant ringing tone" would get people killed.
There are hacks to get people to pay attention anyway, such as checklists, but these hacks are what we could call "not scalable" for many of the situations that people in technology care about. We cannot get people to go through a "should you trust this" checklist every time they receive an email message, especially when phish spammers deliberately craft their messages to create a sense of urgency and short-cut people's judgment. And even checklists are subject to seeing what you expect and not paying attention, especially if you do them over and over again on a routine basis.
(I've written a lot about this in various narrower areas before, eg 1, 2, 3, 4, 5. And in general, everything comes down to people, also.)
Recently I wrote about how Linux network interface names have a
length limit, of 15 characters.
You can work around this limit by giving network interfaces an
'altname' property, as exposed in (for example) 'ip link'. While
you can't work around this at all in Canonical's Netplan, it looks like you can have this for your
VLANs in systemd-networkd, since there's AlternativeName=
in the systemd.link
manual page.
Except, if you look at an actual VLAN configuration as materialized
by Netplan (or written out by hand), you'll discover a problem.
Your VLANs don't normally have .link files, only .netdev
and .network
files (and even your normal Ethernet links may not have .link files).
The AlternativeName= setting is only valid in .link files, because
networkd is like that.
(The AlternativeName= is a '[Link]' section setting and
.network files also have a '[Link]' section, but they allow
completely different sets of '[Link]' settings. The .netdev file,
which is where you define virtual interfaces, doesn't have a '[Link]'
section at all, although settings like AlternativeName= apply
to them just as much as to regular devices. Alternately, .netdev
files could support setting altnames for virtual devices in the
'[NetDev]' section along side the mandatory 'Name=' setting.)
You can work around this indirectly, because you can create a .link file for a virtual network device and have it work:
[Match]
Type=vlan
OriginalName=vlan22-mlab

[Link]
AlternativeNamesPolicy=
AlternativeName=vlan22-matterlab
Networkd does the right thing here even though 'vlan22-mlab' doesn't exist when it starts up; when vlan22-mlab comes into existence, it matches the .link file and has the altname stapled on.
Given how awkward this is (and that not everything accepts or sees altnames), I think it's probably not worth bothering with unless you have a very compelling reason to give an altname to a virtual interface. In my case, this is clearly too much work simply to give a VLAN interface its 'proper' name.
Since I tested, I can also say that this works on a Netplan-based Ubuntu server where the underlying VLAN is specified in Netplan. You have to hand write the .link file and stick it in /etc/systemd/network, but after that it cooperates reasonably well with a Netplan VLAN setup.
Recently, Verisimilitude left a comment on this entry of mine about binding TCP and UDP ports to a specific address. That got me thinking about features that have become standard elements of things despite not being officially specified and required.
TCP and UDP are more or less officially specified in various RFCs and are implicitly specified by what happens on the wire. As far as I know, nowhere in these standards (or wire behavior) does anything require that a multi-address host machine allow you to listen for incoming TCP or UDP traffic on a specific port on only a restricted subset of those addresses. People talking to your host have to use a specific IP, obviously, and established TCP connections have specific IP addresses associated with them that can't be changed, but that's it. Hosts could have an API where you simply listened to a specific TCP or UDP port and then they provided you with the local IP when you received inbound traffic; it would be up to your program to do any filtering to reject addresses that you didn't want used.
However, I don't think anyone has such an API, and anything that did would likely be considered very odd and 'non-standard'. It's become an implicit standard feature of TCP and UDP that you can opt to listen on only one or a few IP addresses of a multi-address host, including listening only on localhost, and connections to your (TCP) port on other addresses are rejected without the TCP three-way handshake completing. This has leaked through into the behavior that TCP clients expect in practice; if a port is not available on an IP address, clients expect to get a TCP layer 'connection refused', not a successful connection and then an immediate disconnection. If a host had the latter behavior, clients would probably not report it as 'connection refused' and some of them would consider it a sign of a problem on the host.
This particular (API) feature comes from a deliberately designed
element of the BSD sockets API, the bind() system call. Allowing you to
bind() local addresses to your sockets means that you can set the
outgoing IP address for TCP connection attempts and UDP packets,
which is important in some situations, but BSD could have provided
a different API for that. BSD's bind() API does allow you maximum
freedom with only a single system call; you can nail down either
or both of the local IP and the local port. Binding the local port (but not
necessarily the local IP) was important in BSD Unix because it
was part of a security mechanism.
(This created an implicit API requirement for other OSes. If you wanted your OS to have an rlogin client, you had to be able to force the use of a low local port when making TCP connections, because the BSD rlogind.c simply rejected connections from ports that were 1024 and above even in situations where it would ask you for a password anyway.)
A number of people copied the BSD sockets API rather than design their own. Even when people designed their own API for handling networking (or IPv4 and later IPv6), my impression is that they copied the features and general ideas of the BSD sockets API rather than starting completely from scratch and deviating significantly from the BSD API. My usual example of a relatively divergent API is Go, which is significantly influenced by a quite different networking history inside Bell Labs and AT&T, but Go's net package still allows you to listen selectively on an IP address.
(Of course Go has to work with the underlying BSD sockets API on many of the systems it runs on; what it can offer is mostly constrained by that, and people will expect it to offer more or less all of the 'standard' BSD socket API features in some form.)
PS: The BSD TCP API doesn't allow a listening program to make a decision about whether to allow or reject an incoming connection attempt, but this is turned out to be a pretty sensible design. As we found out witn SYN flood attacks, TCP's design means that you want to force the initiator of a connection attempt to prove that they're present before the listening ('server') side spends much resources on the potential connection.
Over on the Fediverse, I shared a discovery:
This is my (sad) face that Linux interfaces have a maximum name length. What do you mean I can't call this VLAN interface 'vlan22-matterlab'?
Also, this is my annoyed face that Canonical Netplan doesn't check or report this problem/restriction. Instead your VLAN interface just doesn't get created, and you have to go look at system logs to find systemd-networkd telling you about it.
(This is my face about Netplan in general, of course. The sooner it gets yeeted the better.)
Based on both some Internet searches and looking at kernel headers,
I believe the limit is 15 characters for the primary name of an
interface. In headers, you will find this called IFNAMSIZ (the
kernel) or IF_NAMESIZE (glibc), and it's defined to be 16 but
that includes the trailing zero byte for C strings.
(I can be confident that the limit is 15, not 16, because 'vlan22-matterlab' is exactly 16 characters long without a trailing zero byte. Take one character off and it works.)
At the level of ip commands, the error message you get is on the unhelpful side:
# ip link add dev vlan22-matterlab type wireguard
Error: Attribute failed policy validation.
(I picked the type for illustration purposes.)
Systemd-networkd gives you a much better error message:
/run/systemd/network/10-netplan-vlan22-matterlab.netdev:2: Interface name is not valid or too long, ignoring assignment: vlan22-matterlab
(Then you get some additional errors because there's no name.)
As mentioned in my Fediverse post, Netplan tells you nothing. One direct consequence of this is that in any context where you're writing down your own network interface names, such as VLANs or WireGuard interfaces, simply having 'netplan try' or 'netplan apply' succeed without errors does not mean that your configuration actually works. You'll need to look at error logs and perhaps inventory all your network devices.
(This isn't the first time I've seen Netplan behave this way, and it remains just as dangerous.)
As covered in the ip link manual page, network interfaces can have either or both of aliases and 'altname' properties. These alternate names can be (much) longer than 16 characters, and the 'ip link property' altname property can be used in various contexts to make things convenient (I'm not sure what good aliases are, though). However this is somewhat irrelevant for people using Netplan, because the current Netplan YAML doesn't allow you to set interface altnames.
You can set altnames in networkd .link files, as covered in the
systemd.link
manual page. The direct thing you want is AlternativeName=,
but apparently you may also want to set a blank alternative names
policy, AlternativeNamesPolicy=.
Of course this probably only helps if you're using systemd-networkd
directly, instead of through Netplan.
PS: Netplan itself has the notion of Ethernet interfaces having symbolic names, such as 'vlanif0', but this is purely internal to Netplan; it's not manifested as an actual interface altname in the 'rendered' systemd-networkd control files that Netplan writes out.
(Technically this applies to all physical device types.)
When querying Spamhaus DNS blocklists, either their public mirrors or through a DQS account, the DNS blocklists can potentially return error codes in 127.255.255.0/24 (also). Although Exim has a variety of DNS blocklist features, it doesn't yet let you match return codes based on CIDR netblocks. However, it does have a magic way of doing this.
The magic way is to stick '!&0.255.255.0' on the end of the DNS blocklist name. This is a negated DNS (blocklist) matching conditions, specifically a negated bitmask (a 'bitwise-and'). The whole thing looks like:
deny dnslists = zen.spamhaus.org!&0.255.255.0
What this literally means is to consider the lookup to have failed if the resulting IP address matches '*.255.255.*'. Because Exim already requires successful lookup results to be in 127.0.0.0/8, this implicitly constrains the entire result to not match 127.255.255.*, which is what we want.
As covered in Additional matching conditions for DNS lists, Exim can match DNS blocklist results by a specific IP or a bitmap, the latter of which is written as, eg, '&0.255.255.0'. When you match by bitmap, the IP address is anded with the bitmap and the result must be the same as the bitmap (meaning that all bits set in the bitmask are set in the IP address):
(ip & bitmask) == bitmask
(You can consider both the IP and the bitmask as 32-bit numbers, or you can consider each octet separately in both, whichever makes it easier.)
There's no way to say that the match succeeds if the result of and'ing the IP and the bitmask is non-zero (has any bits set). For small number of bits, you can sort of approximate that by using multiple bitmasks. For example, to succeed if either of the two lowest bits are set:
a.example&0.0.0.1,0.0.0.2
(The 'lowest bit' here is the lowest bit of the rightmost octet.)
If you negate a bitmask condition by writing it as '!&', the lookup is considered to have failed if the '&<bitmask>' match is successful, which is to say that the IP address anded with the bitmask is the same as the bitmask.
This is why '!&0.255.255.0' does what we want. '&0.255.255.0' successfully matches if the IP address is exactly *.255.255.*, because both middle octets have all their bits set in the mask so they have to have all their bits set in the IP address, and because the first and last octets in the mask are 0, their value in the IP address isn't looked at. Then we negate this, so the lookup is considered to have failed if the bitmask matched, which would mean that Spamhaus returned results in 127.255.255.0/24.
I'm writing all of that out in detail because here is what the current Exim documentation says about negated DNS bitmask conditions:
Negation can also be used with a bitwise-and restriction. The dnslists condition with only be true if a result is returned by the lookup which, anded with the restriction, is all zeroes.
This is not how Exim behaves. If it was how Exim behaves, Spamhaus DBL lookups would not work correctly with '!&0.255.255.0'. DBL lookups return results in 127.0.1.0/24; if you bitwise-and that with 0.255.255.0, you get '0.0.1.0', which is not all zeroes.
(It could be useful to have a version of '&' that succeeded if any of the bits in the result were non-zero, but that's not what Exim has today, as discussed above.)
For reasons outside the scope of this entry, we recently switched from Spamhaus's traditional public DNS (what is now called the 'public mirrors') to an account with their Data Query Service. The DQS data can still be queried via DNS, which presents a problem: DNS queries have no way to carry any sort of access key with them. Spamhaus has solved this problem by embedding your unique access key in the zone name you must use. Rather than querying, say, zen.spamhaus.org, you query '<key>.zen.dq.spamhaus.net'. Because your DQS key is tied to your account and your account has query limits, you don't want to spread your DQS key around for other people to pick up and use.
We use the Exim mailer (which is more of a mailer construction kit out of the box). Exim has a variety of convenient features for using DNS (block) lists. One of them is that when Exim finds an entry in a DNS blocklist in an ACL, it sets some (Exim) variables that you can use later in various contexts, such as creating log messages. To more or less quote from the Exim documentation on (string) expansion variables:
$dnslist_domain
$dnslist_matched
$dnslist_text
$dnslist_valueWhen a DNS (black) list lookup succeeds, these variables are set to contain the following data from the lookup: the list’s domain name, the key that was looked up, the contents of any associated TXT record, and the value from the main A record. [...]
To make life easier on yourself, it's conventional to use these variables (among others) in things like SMTP error messages and headers that you add to messages:
deny hosts = !+local_networks
     message = $sender_host_address is listed \
               at $dnslist_domain: $dnslist_text
     dnslists = rbl-plus.mail-abuse.example

warn dnslists = weird.example
     add_header = X-Us-DNSBL: listed in $dnslist_domain
However, if you're using Spamhaus DQS, using $dnslist_domain as these examples do is dangerous. The DNS list domain will be the full domain, and that full domain will include your DQS access key, which you will thus be exposing in message headers and SMTP error messages. You probably don't want to do that.
(Certainly it feels like a bad practice to leak a theoretically confidential value into the world, even if the odds are that no one is going to pick it up and abuse it.)
You have two options. The first option is to simply hard code some appropriate name for the list instead of using $dnslist_domain. However, this only works if you're using a single DNS list in each ACL condition, instead of something where you check multiple DNS blocklists at once (with 'dnslists = a.example : b.example : c.example'). It's also a bit annoying to have to repeat yourself.
(This is what I did to our Exim configuration when I realized the problem.)
The second option is that Exim has a comprehensive string expansion
language,
so determined people can manipulate $dnslist_domain to detect
that it contains your DQS key and remove it. The brute force way
would be to use ${sg} (from expansion items)
to replace your key with nothing, something like (this is untested):
${sg{$dnslist_domain}{<DQS key>}{}}
You could probably wrap this up in an Exim macro,
call it 'DNSLIST_NAME', and then write ACLs as, say:
deny hosts = !+local_networks
     message = $sender_host_address is listed \
               at DNSLIST_NAME
     dnslists = rbl-plus.mail-abuse.example
(Because we're using ${sg}, we won't change the name of a DNSBL domain that doesn't contain the DQS key.)
This isn't terrible and it does cope with a single Exim ACL condition that checks multiple DNS blocklists.
Netplan is Canonical's more or less mandatory method of specifying networking on Ubuntu. Netplan has a collection of limitations and irritations, and recently I ran into a new one, which is how VLANs can and can't be specified. To explain this, I can start with the YAML configuration language. To quote the top level version, it looks like:
network:
  version: NUMBER
  renderer: STRING
  [...]
  ethernets: MAPPING
  [...]
  vlans: MAPPING
  [...]
To translate this, you specify VLANs separately from your Ethernet or other networking devices. On the one hand, this is nicely flexible. On the other hand it creates a problem, because here is what you have to write for VLAN properties:
network:
  vlans:
    vlan123:
      id: 123
      link: enp5s0
      addresses: <something>
Every VLAN is on top of some networking device, and because VLANs are specified as a separate category of top level devices, you have to name the underlying device in every VLAN (which gets very annoying and old very fast if you have ten or twenty VLANs to specify). Did you decide to switch from a 1G network port to a 10G network port for the link with all of your VLANs on it? Congratulations, you get to go through every 'vlans:' entry and change its 'link:' value. We hope you don't overlook one.
(Or perhaps you had to move the system disks from one model of 1U server to another model of 1U server because the hardware failed. Or you would just like to write generic install instructions with a generic block of YAML that people can insert directly.)
The best way for Netplan to deal with this would be to allow you to also specify VLANs as part of other devices, especially Ethernet devices. Then you could write:
network:
  ethernet:
    enp5s0:
      vlans:
        vlan123:
          id: 123
          addresses: <something>
Every VLAN specified in enp5s0's configuration would implicitly use enp5s0 as its underlying link device, and you could rename all of them trivially. This also matches how I think most people think of and deal with VLANs, which is that (obviously) they're tied to some underlying device, and you want to think of them as 'children' of the other device.
(You can have an approach to VLANs where they're more free-floating and the interface that delivers any specific VLAN to your server can change, for load balancing or whatever. But you could still do this, since Netplan will need to keep supporting the separate 'vlans:' section.)
If you want to work around this today, you have to go for the far less convenient approach of artificial network names.
network:
  ethernet:
    vlanif0:
      match:
        name: enp5s0

  vlans:
    vlan123:
      id: 123
      link: vlanif0
      addresses: <something>
This way you only need to change one thing if your VLAN network interface changes, but at the cost of doing a non-standard way of setting up the base interface. (Yes, Netplan accepts it, but it's not how the Ubuntu installer will create your netplan files and who knows what other Canonical tools will have a problem with it as a result.)
We have one future Ubuntu server where we're going to need to set up a lot of VLANs on one underlying physical interface. I'm not sure which option we're going to pick, but the 'vlanif0' option is certainly tempting. If nothing else, it probably means we can put all of the VLANs into a separate, generic Netplan file.
Over on the Fediverse I mentioned something recently:
Current status: doing extremely "I don't know what I'm really doing, I'm copying from a website¹" things with Linux tc to see if I can improve my home Internet latency under load without doing too much damage to bandwidth or breaking my firewall rules. So far, it seems to work and things² claim to like the result.
¹ <documentation link>
² https://bufferbloat.libreqos.com/ via @davecb
What started this was running into a Fediverse post about the bufferbloat test, trying it, and discovering that (as expected) my home DSL link performed badly, with significant increased latency during downloads, uploads, or both. My memory is that reported figures went up to the area of 400 milliseconds.
Conveniently for me, my Linux home desktop is also my DSL router; it speaks PPPoE directly through my DSL modem. This means that doing traffic shaping on my Linux desktop should cover everything, without any need to wrestle with a limited router OS environment. And there was some more or less cut and paste directions on the site.
So my outbound configuration was simple and obviously not harmful:
tc qdisc add root dev ppp0 cake bandwidth 7.6Mbit
The bandwidth is a guess, although one informed by checking both my raw DSL line rate and what testing sites told me.
The inbound configuration was copied from the documentation and it's where I don't understand what I'm doing:
ip link add name ifb4ppp0 type ifb
tc qdisc add dev ppp0 handle ffff: ingress
tc qdisc add dev ifb4ppp0 root cake bandwidth 40Mbit besteffort
ip link set ifb4ppp0 up
tc filter add dev ppp0 parent ffff: matchall action mirred egress redirect dev ifb4ppp0
(This order follows the documentation.)
Here is what I understand about this. As covered in the tc manual page, traffic shaping and scheduling happens only on 'egress', which is to say for outbound traffic. To handle inbound traffic, we need a level of indirection to a special ifb (Intermediate Functional Block) (also) device, that is apparently used only for our (inbound) tc qdisc.
So we have two pieces. The first is the actual traffic shaping on the IFB link, ifb4ppp0, and setting the link 'up' so that it will actually handle traffic instead of throw it away. The second is that we have to push inbound traffic on ppp0 through ifb4ppp0 to get its traffic shaping. To do this we add a special 'ingress' qdisc to ppp0, which applies to inbound traffic, and then we use a tc filter that matches all (ingress) traffic and redirects it to ifb4ppp0 as 'egress' traffic. Since it's now egress traffic, the tc shaping on ifb4ppp0 will now apply to it and do things.
When I set this up I wasn't certain if it was going to break my non-trivial firewall rules on the ppp0 interface. However, everything seems to fine, and the only thing the tc redirect is affecting is traffic shaping. My firewall blocks and NAT rules are still working.
Applying these tc rules definitely improved my latency scores on the test site; my link went from an F rating to an A rating (and a C rating for downloads and uploads happening at once). Does this improve my latency in practice for things like interactive SSH connections while downloads and uploads are happening? It's hard for me to tell, partly because I don't do such downloads and uploads very often, especially while I'm doing interactive stuff over SSH.
(Of course partly this is because I've sort of conditioned myself out of trying to do interactive SSH while other things are happening on my DSL link.)
The most I can say is that this probably improves things, and that since my DSL connection has drifted into having relatively bad latency to start with (by my standards), it probably helps to minimize how much worse it gets under load.
I do seem to get slightly less bandwidth for transfers than I did before; experimentation says that how much less can be fiddled with by adjusting the tc 'bandwidth' settings, although that also changes latency (more bandwidth creates worse latency). Given that I rarely do large downloads or uploads, I'm willing to trade off slightly lower bandwidth for (much) less of a latency hit. One reason that my bandwidth numbers are approximate anyway is that I'm not sure how much PPPoE DSL framing compensation I need.
(The Arch wiki has a page on advanced traffic control that has some discussion of tc.)
If my understanding is correct, we can rewrite the commands to set up inbound traffic shaping to be more clearly ordered:
# Create and enable ifb link
ip link add name ifb4ppp0 type ifb
ip link set ifb4ppp0 up

# Set CAKE with bandwidth limits for
# our actual shaping, on ifb link.
tc qdisc add dev ifb4ppp0 root cake bandwidth 40Mbit besteffort

# Wire ifb link (with tc shaping) to inbound
# ppp0 traffic.
tc qdisc add dev ppp0 handle ffff: ingress
tc filter add dev ppp0 parent ffff: matchall action mirred egress redirect dev ifb4ppp0
The 'ifb4ppp0' name is arbitrary but conventional, set up as 'ifb4<whatever>'.
When I described my current ideal Linux source package format, I said that it should be embedded in the source code of the software being packaged. In a comment, bitprophet had a perfectly reasonable and good preference the other way:
Re: other points: all else equal I think I vaguely prefer the Arch "repo contains just the extras/instructions + a reference to the upstream source" approach as it's cleaner overall, and makes it easier to do "more often than it ought to be" cursed things like "apply some form of newer packaging instructions against an older upstream version" (or vice versa).
The Arch approach is isomorphic to the source RPM format, which has various extras and instructions plus a pre-downloaded set of upstream sources. It's not really isomorphic to the Debian source format because you don't normally work with the split up version; the split up version is just a package distribution thing (as dgit shows).
(I believe the Arch approach is also how the FreeBSD and OpenBSD ports trees work. Also, the source package format you work in is not necessarily how you bundle up and distribute source packages, again as shown by Debian.)
Let's call these two packaging options the inline approach (Debian) and the out of line approach (Arch, RPM). My view is that which one you want depends on what you want to do with software and packages. The out of line approach makes it easier to build unmodified packages, and as bitprophet comments it's easy to do weird build things. If you start from a standard template for the type of build and install the software uses, you can practically write the packaging instructions yourself. And the files you need to keep are quite compact (and if you want, it's relatively easy to put a bunch of them into a single VCS repository, each in its own subdirectory).
However, the out of line approach makes modifying upstream software much more difficult than a good version of the inline approach (such as, for example, dgit). To modify upstream software in the out of line approach you have to go through some process similar to what you'd do in the inline approach, and then turn your modifications into patches that your packaging instructions apply on top of the pristine upstream. Moving changes from version to version may be painful in various ways, and in addition to those nice compact out of line 'extras/instructions' package repos, you may want to keep around your full VCS work tree that you built the patches from.
(Out of line versus inline is a separate issue from whether or not the upstream source code should include packaging instructions in any form; I think that generally the upstream should not.)
As a system administrator, I'm biased toward easy modification of upstream packages and thus upstream source because that's most of why I need to build my own packages. However, these days I'm not sure if that's what a Linux distribution should be focusing on. This is especially true for 'rolling' distributions that mostly deal with security issues and bugs not by patching their own version of the software but by moving to a new upstream version that has the security fix or bug fix. If most of what a distribution packages is unmodified from the upstream version, optimizing for that in your (working) source package format is perfectly sensible.
The Amanda backup system is what we use to handle our backups. One of Amanda's core concepts is a 'dump cycle', the amount of time between normally scheduled full backups for filesystems. If you have a dumpcycle of 7 days and Amanda does a full backup of a filesystem on Monday, its normal schedule for the next full backup is next Monday. However, Amanda can 'promote' a full backup ahead of schedule if it believes there's room for the full backup in a given backup run. Promoting full backups is a good idea in theory because it reduces how much data you need to restore a filesystem.
The amanda.conf configuration file has a per-dumptype option that affects this:
- maxpromoteday int
- Default: 10000. The maximum number of day[s] for a promotion, set it 0 if you don't want promotion, set it to 1 or 2 if your disks get overpromoted.
As written, I find this a little bit opaque (to be polite). What
maxpromoteday controls is the maximum of how many days ahead of
the normal schedule Amanda will promote a full backup. For example,
if you have a 7-day dump cycle, a maxpromoteday of 2, and did a
full dump of a filesystem on Monday, the earliest Amanda will
possibly schedule a 'promoted' full backup is two days before next
Monday, so the coming Saturday or Sunday. By extension, if you set
maxpromoteday to '0', Amanda will only consider promoting a full
backup of a filesystem zero days ahead of schedule, which is to say
'not at all'. Any value larger than your 'dumpcycle' setting has
no effect, because Amanda is already doing full backups that often
and so a larger value doesn't add any extra constraints on Amanda's
scheduling of full backups.
You might wonder why you'd want to set 'maxpromoteday' down to
limit full backup promotions, and naturally there is a story here.
Amanda is a very old backup system, and although it's not necessarily used with physical tapes and tape robots today (our 'tapes' are HDDs), many of its behaviors date back to that era. While the modern version of Amanda can split up a single large backup of a single (large) filesystem across multiple 'tapes', what it refuses to do is to split such a backup across multiple Amanda runs. If a filesystem backup can't be completely written out to tape in the current Amanda run, any partially written amount is ignored; the entire filesystem backup will be (re)written in the next run, using up the full space. If Amanda managed to write 90% of your large filesystem to your backup media today, that 90% is ignored because the last 10% couldn't be written out.
The consequence of this is that if you're backing up large filesystems with Amanda, you really don't want to run out of tape space during a backup run because this can waste hundreds of gigabytes of backup space (or more, if you have multi-terabyte filesystems). In environments like ours where the 'tapes' are artificial and we have a lot of them available to Amanda (our tapes a partitions on HDDs and we have a dozen HDDs or more mounted on each backup server at any given time), the best way to avoid running out of tape space during a single Amanda run is to tell Amanda that it can use a lot of tapes, way more tapes than it should ever actually need.
(Even in theory, Amanda can't perfectly estimate how much space a given full or incremental backup will actually use and so it can run over the tape capacity you actually want it to use. In practice, in many environments you may have to tell Amanda to use 'server side estimates', where it guesses based on past backup behavior, instead of the much more time-consuming 'client side estimates', where it basically does an estimation pass over each filesystem to be backed up.)
However, if you tell Amanda it can use a lot of tapes in a standard Amanda setup, Amanda will see a vast expanse of available tape capacity and enthusiastically reach the perfectly rational conclusion that it should make use of that capacity by aggressively promoting full backups of filesystems (both small and large ones). This is very much not what you (we) actually want. We're letting Amanda use tons of 'tapes' to insure that it never wastes tape space, not so that it can do extra full backups; if Amanda doesn't need to use the tape space we don't want it to touch that tape space.
The easiest way for us to achieve this is to set 'maxpromoteday
0' in our Amanda configuration, at least for Amanda servers that
back up very large filesystems (where the wasted tape space of an
incompletely written backup could be substantial). Unfortunately I
think you'll generally want to set this for all dump types in a
particular Amanda server, because over-promotion of even small(er)
filesystems could eat up a bunch of tape space that you want to
remain unused.
(Amanda talks about 'dumps' because it started out on Unix systems where for a long time the filesystem backup program was called 'dump'. These days your Amanda filesystem backups are probably done with GNU Tar, although I think people still talk about things like 'database dumps' for backups.)
One of the services we operate for the department is a traditional Apache-based shared web server, with things like people's home pages (eg), pages for various groups, and so on (we call this our departmental web server). This web server has been there for a very long time and its URLs have spread everywhere, and in the process it's become quite popular for some things. These days there are a lot of things crawling everything in sight, and our server has no general defenses against them (we don't even have much of a robots.txt).
(Technically our perimeter firewall has basic HTTP and HTTPS brute-force connection rate limits, but people typically have to really work to trigger them and they mostly don't. Although now that I look at yesterday, more IPs wound up listed than I expected, although listings normally last at most five minutes.)
The first, very noticeable thing that we have is people who do very slow downloads from us. Our server rolls over the logs at midnight, but Apache only writes a log record when a HTTP request completes, possibly to the old log file. Yesterday (Tuesday), the last log record was written at 05:24, for a request that started at 22:44. Over the 24 hours that requests were initiated in, we saw 1.2 million requests.
The two most active User-Agents were (in somewhat rounded numbers):
426000 "Mozilla/5.0 (iPhone; CPU iPhone OS 18_0 like Mac OS X) AppleWebKit/605.1.15 (KHTML, like Gecko) Version/18.0 Mobile/15E148 Safari/604.1"
424000 "Mozilla/5.0 (Macintosh; Intel Mac OS X 10_15_7) AppleWebKit/537.36 (KHTML, like Gecko) Chrome/124.0.0 Safari/537.36"
The most active thing that was willing to admit it wasn't a human with a browser was "ChatGPT-User", with just under 20,000 requests. After that came "GoogleOther" and "Amazonbot", at about 12,000 requests each, then "Googlebot" with 10,000 and bingbot with about 6,000. Of course, some of those could be people impersonating the real Googlebot and bingbot.
To my surprise, the most popular HTTP result code by far was HTTP 301 Moved Permanently, at 844,000 responses (HTTP 200s were 347,000, everything else was small by comparison). And most of the requests by the those two most active User-Agents got HTTP 301 responses (roughly 418,000 each). I don't know what's going on there, but someone seems to have latched on to a lot of URLs that require redirects (which include things like directory URLs without the '/' on the end). On the positive side, most of those requests will have been pretty cheap for Apache to handle.
A single DigitalOcean IP claiming to be running Chrome 61 on 'Windows NT 10.0' made 11,000 requests, most of which got HTTP 404 errors because it was requesting URLs like '/wp-login.php'. There's no point complaining to hosting providers about this sort of thing, it's just background noise. No other single IP stood out to that degree (well, our monitoring system made over 10,000 requests, but that's expected). Google mostly crawled from a few IPs, with large counts, but other crawlers were more spread out.
To find out more traffic information, we need to go to looking at Autonomous System Numbers (ASNs), using asncounter. This reports:
 count   percent ASN     AS
 463536  36.55   210906  BITE-US, LT
 152237  12.0    212286  LONCONNECT, GB
 65064   5.13    3257    GTT-BACKBONE GTT, US
 53927   4.25    7385    ABUL-14-7385, US
 45255   3.57    8075    MICROSOFT-CORP-MSN-AS-BLOCK, US
 32557   2.57    7029    WINDSTREAM, US
 32101   2.53    55286   SERVER-MANIA, CA
 30037   2.37    15169   GOOGLE, US
 24412   1.92    239     UTORONTO-AS, CA
 21745   1.71    7015    COMCAST-7015, US
 16311   1.29    64200   VIVIDHOSTING, US
 [...]
And then for prefixes:
 count   percent prefix  ASN     AS
 64312   5.07    138.226.96.0/20 3257    GTT-BACKBONE GTT, US
 43459   3.43    85.254.128.0/22 210906  BITE-US, LT
 43161   3.4     185.47.92.0/22  210906  BITE-US, LT
 43111   3.4     45.131.216.0/22 212286  LONCONNECT, GB
 43040   3.39    45.145.136.0/22 212286  LONCONNECT, GB
 42998   3.39    45.138.248.0/22 212286  LONCONNECT, GB
 42870   3.38    185.211.96.0/22 210906  BITE-US, LT
 32365   2.55    85.254.112.0/22 210906  BITE-US, LT
 26937   2.12    66.249.64.0/20  15169   GOOGLE, US
 23785   1.88    128.100.0.0/16  239     UTORONTO-AS, CA
 23088   1.82    45.154.148.0/22 212286  LONCONNECT, GB
 21767   1.72    85.254.42.0/23  210906  BITE-US, LT
 [and then five more BITE-US prefixes at the same
  volume level, then many more prefixes]
Given that we have two extremely prolific User-Agents, let's look at where those requests came from in specific, and you will probably not be surprised at the results:
 count   percent ASN     AS
 462925  54.37   210906  BITE-US, LT
 152155  17.87   212286  LONCONNECT, GB
 64321   7.55    3257    GTT-BACKBONE GTT, US
 53649   6.3     7385    ABUL-14-7385, US
 32287   3.79    7029    WINDSTREAM, US
 31955   3.75    55286   SERVER-MANIA, CA
 21710   2.55    7015    COMCAST-7015, US
 16304   1.92    64200   VIVIDHOSTING, US
 [...]
If you have the ability to block traffic by ASN and you don't need to accept requests from clouds and your traffic is anything like this, you can probably drop a lot of it quite easily.
I can ask a different question: if we exclude those two popular User-Agents and look only at successful requests (HTTP 200 responses), where do they come from?
 count   percent ASN     AS
 38821   11.61   8075    MICROSOFT-CORP-MSN-AS-BLOCK, US
 25510   7.63    15169   GOOGLE, US
 16968   5.07    239     UTORONTO-AS, CA
 12816   3.83    14618   AMAZON-AES, US
 11529   3.45    396982  GOOGLE-CLOUD-PLATFORM, US
 [...]
(There are about 334,000 of these in total.)
The 'UTORONTO-AS' listing includes our own monitoring, with its 10,000 odd requests. Much of Google's requests come from their 66.249.64.0/20 prefix, which is mostly or entirely used by various Google crawlers.
Around 138,000 requests were for a set of commonly used ML training data, and they probably account for most of the bandwidth used by this web server (which typically averages 40 Mbytes/sec of outgoing bandwidth all of the time on weekdays).
(I've previously done HTTP/2 stats for this server as of mid 2025.)
I mentioned on the Fediverse a while back that we have air conditioners on our internal network. Well, technically what we have on the internal network is separate (and optional) controller devices that connect to the physical AC units themselves, but as they say, this is close enough. Of course there's a story here:
Why do we have networked AC controllers? Well, they control portable AC units that are in our machine rooms for emergency use, and having their controllers on our internal network means we can possibly turn them on from home if the main room AC stops working out of hours, on weekends, etc.
(It would still be a bad time, just maybe a little less bad.)
Our machine rooms are old (cf) and so are their normal AC units. Over the years we've had enough problems with these AC units that we've steadily accumulated emergency measures. A couple of years ago, these emergency measures reached the stage of pre-deploying wheeled portable AC units with their exhaust hoses connected up to places where they could vent hot air that would take it outside of the machine room.
Like most portable ACs, these units are normally controlled in person from their front panels (well, top panels). However, these are somewhat industrial AC units and you could get optional network-accessible controllers for them; after thinking about it, we did and then hooked the controllers (and thus the ACs) up to our internal management network. As I mentioned, the use case for networked control of these AC units is to turn them on from home during emergencies. They don't have anywhere near enough cooling power to cover all of the systems we normally have running in our machine rooms, but we might be able to keep a few critical systems up rather than being completely down.
(We haven't had serious AC issues since we put these portable AC units into place, so we aren't sure how well they'd perform and how much we'd be able to keep up.)
These network controllers can get status information (including temperatures) from the ACs and have some degree of support for SNMP, so we could probably pull information from them for metrics purposes if we wanted to. Right now we haven't looked into this, partly because we have our own temperature monitoring and partly because I'm not sure I trust the SNMP server implementation to be free of bugs, memory leaks, and other things that might cause problems for the overall network controller.
(Like most little things, these network controllers are probably running some terrifyingly ancient Linux kernel and software stack. A quick look at the HTTP server headers says that it's running a clearly old version of nginx on Ubuntu, although it's slightly more recent than I expected.)
I recently wrote about the complexities of getting programs to report the TLS certificates they use, where I theorized about writing a script to scrape this information out of places like the Apache configuration files, and then today I realized the obvious specific approach for our environment:
Obvious realization is obvious: since we universally use Let's Encrypt with certbot and follow standard naming, I can just look in /etc/letsencrypt/live to find all live TLS certificates and (a) host name for them, for cross-checking against our monitoring.
Our TLS certificates usually have multiple names associated with them, only one of which is the directory name in /etc/letsencrypt/live. However, we usually monitor the TLS certificate under what we think of as the primary name, and in any case we can make this our standard Prometheus operating procedure.
In our Prometheus environment we create a standard label for the
'host' being monitored, including for
metrics obtained through Blackbox. Given that Blackbox exposes
TLS certificate metrics, we can use
things like direct curl queries to Prometheus
to verify that we have TLS certificate monitoring for everything
in /etc/letsencrypt/live. The obvious thing to check is that we
have a probe_ssl_earliest_cert_expiry metric with the relevant
'host' value for each Let's Encrypt primary name.
If we want to, we can go further by looking at probe_ssl_last_chain_info. This Blackbox metric directly exposes labels for the TLS 'subject' and 'subjectalternative', so we can in theory search them for either the primary name that Let's Encrypt will be using or for what we consider an important name to be covered. It appears that this wouldn't be needed to cover any additional TLS certificates for us, as we're already checking everything under its primary name.
(Well, we are after I found one omission in a manual check today.)
With the right tools (also), I don't need to make this a pre-written shell script that runs on each machine; instead, I can do this centrally by hand every so often. On the one hand this isn't as good as automating it, but on the other hand every bit of locally built automation is another bit of automation we have to maintain ourselves. We mostly haven't had a problem with tracking TLS certificates, and we have other things to notice failures.
(I should probably write a personal script to do this, just to capture the knowledge.)
I recently had to deal with GNU Emacs lsp-mode in a context where I cared a bit about its keybindings, and in the process of that ran across mention of what one could call its leader prefix, s-l. People who use GNU Emacs a lot will know what this specific 's-' notation means, but I'm not one of them, so it took me a bit of research to work it out. This is GNU Emacs' notation for 'Super', one of the theoretical extra key modifiers that you can have on keyboards.
(I suspect that lsp-mode uses s-l as its prefix on its key bindings because everything else good is taken.)
My impression is that it's normal for Unix desktop environments to have a key mapped to 'Super', often the left 'Microsoft' key; this is the case in my unusual X desktop environment. On Windows and macOS machines, you can apparently set up mappings in GNU Emacs itself as covered by Xah Lee in "Emacs Keys: Super Hyper" (via). This gives me a working Super key (if I remember it, which I hopefully will now) when I'm using a GUI GNU Emacs that has direct access to relatively raw key information, either locally or on a server with X forwarding.
However, things aren't so good for me if I'm using GNU Emacs in any sort of terminal window. Unlike Alt, for which there's a standard way to handle it in terminals, there appears to be no special handling for Super in either xterm or Gnome-Terminal. Super plus a regular character gives me the regular character, both locally and over SSH connections. In this environment, the only way to access Super-based bindings is with the special and awkward GNU Emacs way to add Super (and Hyper) to key sequences. For Super, this is 'C-x @ s ...', and you can see why I'm not enthused about typing it all that often. In practice, I'm more likely to invoke obscure (to me) lsp-mode things through M-x and orderless.
Fortunately, I think lsp-mode is the only thing that has Super bindings in my usual GNU Emacs environment, which means this is something I mostly won't need to care about. Given the challenges in using Super, I'll avoid any temptation to bind my own things with it. I also suspect that there's pretty much no hope for (Unix) terminal emulators and the terminal environment to add support for it, which will probably discourage other Emacs addons from using it.
(I did a crude search of all of the .el files I use and no obvious Super bindings turned up other than lsp-mode's.)
Mike Hoye recently wrote Powering Up, which is in part about helping people install (desktop) Linux, and the Fediverse thread version of it reminded me of something that I don't do enough of:
A related thing I've taken to doing before potential lurching changes (like Linux distribution upgrades) is to take screenshots and window images. Because comparing a now and then image is a heck of a lot easier than restoring backups, and I can look at it repeatedly as I fix things on the new setup.
Linux distributions and the software they package have a long history of deciding to change things for your own good. They will tinker with font choices, font sizes, default DPI determinations, the size of UI elements, and so on, not quite at the drop of a hat but definitely when you do something like upgrade your distribution and bring in a bunch of significant package version changes (and new programs to replace old programs).
Some people are perfectly okay with these changes. Other people, like me, are quite attached to the specifics of how their current desktop environment looks and will notice and be unhappy about even relatively small changes (eg, also). However, because we're fallible humans, people like me can't always recognize exactly what changed and remember exactly what the old version looked like (these two are related); instead, sometimes all we have is the sense that something changed but we're not quite sure exactly what or exactly how.
Screenshots and window images are the fix for that unspecific feeling. Has something changed? You can call up an old screenshot to check, and to example what (and then maybe work out how to reverse it, or decide to live with the change). Screenshots aren't perfect; for example, they won't necessarily tell you what the old fonts were called or what sizes were being used. But they're a lot better than trying to rely on memory or other options.
It would probably also do me good to get into the habit of taking screenshots periodically, even outside of distribution upgrades. Looking back over time every so often is potentially useful to see more subtle, more long term changes, and perhaps ask myself either why I'm not doing something any more or why I'm still doing it.
(Currently I'm somewhat lackadasical about taking screenshots even before distribution upgrades. I have a distribution upgrade process but I haven't made screenshots part of it, and I don't have an explicit checklist for the process. Which I definitely should create. Possibly I should also try to capture font information in text form, to the extent that I can find it.)
One of the practical reasons that TLS certificates have dangerous expiry times is that in most environments, it's up to you to remember to add monitoring for each TLS certificate that you use, either as part of general purpose monitoring of the service or specific monitoring for certificate expiry. It would be nice if programs that used TLS certificates inherently monitored their expiry, but that's a fairly big change (for example, you have to decide how to send alerts about that information). A nominally easier change would be for programs routinely to be able to report what TLS certificates they're using, either as part of normal metrics and log messages or through some additional command line switch.
(If your program uses TLS certificates and it has some sort of built in way of reporting metrics, it would be very helpful to system administrators if it reported basic TLS certificate metrics like the 'notAfter' time.)
In a lot of programs, this would be relatively straightforward (in theory). A common pattern is for programs to read in all of the TLS certificates they're going to use on startup, before they drop privileges, which means that these programs reliably know what all of those certificates are (and some programs will abort if some TLS certificates can't be read). They could then report the TLS certificate file paths on startup, either as part of their regular startup or in a special 'just report configuration information' mode. In many cases, one could write your own script that scanned the program's configuration files and did a reasonably good job of finding all of the TLS certificate filenames (and you could then make it report the names those TLS certificates were for, and cross-check this against your existing monitoring).
(I should probably write such a script for our Apache environment, because adding TLS based virtual hosts and then forgetting to monitor them is something we could definitely do.)
However, not all programs are straightforward this way. There are some programs that can at least potentially generate the TLS certificate file name on the fly at runtime (for example, Exim's settings for TLS certificate file names are 'expanded strings' that might depend on connection parameters). And even usually straightforward programs like Apache can have conditional use of TLS certificates, although this probably will only leave you doing some extra monitoring of unused TLS certificates (let's assume you're not using SSLCertificateFile token identifiers). These programs would probably need to log TLS certificate filenames on their first use, assuming that they cache loaded TLS certificates rather than re-read them from scratch every time they're necessary.
There's also no generally obvious and good way to expose this information, which means that logging it or printing it out is only the first step and not necessarily deeply useful by itself. If programs put it into logs, people have to pull it out of logs; if programs report it from the command line, people need to write additional tooling. If a program has built in metrics that it exposes in some way, exposing metrics for any TLS certificates it uses is great, but most programs don't have their own metrics and statistics systems.
(Still, it would be nice if programs supported this first step.)
A while back I wrote an entry about understanding reading all
available things from a Go channel (with a timeout), where the code used two selects
to, well, let me quote myself:
The goal of waitReadAll() is to either receive (read) all currently available items from a channel (possibly a buffered one) or to time out if nothing shows up in time. This requires two nested selects, with the inner one in a for loop.
In a recent comment on that entry, Aristotle Pagaltzis proposed a code variation that only used
a single select:
func waitReadAll[T any](c chan T, d time.Duration) ([]T, bool) {
    var out []T
    for {
        select {
        case v, ok := <-c:
            if !ok {
               return out, false
    	       }
            out = append(out, v)

        case <-time.After(d):
            if len(out) == 0 {
               return out, true
            }

        default:
            return out, true
        }
    }
}
Aristotle Pagaltzis wrote tests for this code in the Go
playground, but despite passing
those tests, this code has an intrinsic bug that means it can't work
as designed. The bug is that if this code is entered with nothing in
the channel, the default case is immediately triggered rather than
it waiting for the length of the timeout.
When I saw this code, I was convinced it had the bug and so I tried
to modify the Go playground code
to have a test that would expose the bug. However, I couldn't find
an easy way to do so at the time, and even now my attempts have
been somewhat awkward, so at the least I think it's not obvious how
to do this.
In Go 1.25 (and later), the primary tool for testing synchronization
and concurrency is the testing/synctest package (also). Running our hypothetical test with
synctest.Test() do it
in an environment where time won't advance arbitrarily on us,
insuring that the timeout in waitReadAll() won't trigger before
we can do other things, like send to the channel. To create ordering
in our case, I believe we can use synctest.Wait(). Consider this sketched
code inside a synctest.Test():
c := make(chan int)
// sending goroutine:
go func() {
    // Point 1
    synctest.Wait()
    // Point 2
    time.Sleep(1*time.Second)
    c <- 1
}

// Point 3 (receiving goroutine)
out, ok = waitReadAll(c, 2*time.Second)
// assert ok and len(out) == 1
The synctest.Wait() in the sending goroutine at point 1 will wait
until everything is 'durably blocked'; the first durable block point
is in theory a working select inside waitReadAll(), called at
point 3 in a different goroutine. Then in our sending goroutine at
point 2 we use time.Sleep() to wait less than the timeout, forcing
ordering, and finally we send to the channel, which waitReadAll()
should pick up before it times out. This (and a related test for a
timeout) works properly with a working waitReadAll(), but it took
a bunch of contortions to avoid having it panic in various ways
with the buggy version of waitReadAll(). I'm also not convinced my
testing code is completely correct.
(Some of the initial panics came from me learning that you often want to avoid using t.Fatal() inside a synctest bubble; instead you want to call t.Error() and arrange to have the rest of your code still work right.)
Effectively I'm using synctest to try to create an ordering of
events between two goroutines without modifying any code to have
explicit locking or synchronization. Synctest doesn't completely
serialize execution but it does create predictable 'durable blocking'
points where I know where everything is if things are working
correctly. But it's awkward, and I can't directly wait and check
for a blocked select at point 1.
Synctest also makes certain things that normally would be races into safer, probably race-free operations. Consider a version of this test with a bit more checking:
c := make(chan int)
readall := false
go func() {
    // Point 1
    synctest.Wait()
    // Point 2
    time.Sleep(1*time.Second)
    if readall {
       // failure!
    }
    c <- 1
}

// Point 3
out, ok = waitReadAll(c, 2*time.Second)
readall = true
// assert ok and len(out) == 1
Because of how synctest.Wait() and time work within synctest bubbles,
I believe in theory the only way that the two goroutines can access
readall at the same time is if waitReadAll() is delaying for the
same amount of time as our sending goroutine (instead of the amount
of time we told it to). But the whole area is alarmingly subtle and
I'm not sure I'm right.
(One of the synctest examples uses an unguarded variable in broadly this way.)
It's entirely possible that there's an easier way to do this sort
of testing of select expressions, and I'd certainly hope so.
However, synctest itself
is quite new, so perhaps there's no better way right now. Also,
possibly this sort of low level testing isn't necessary very often
in practice. Both Aristotle Pagaltzis and I are in a sort of
artificial situation where we're narrowly focused on a single
peculiar function.
Modern smartphones have a lot of sensors; for example, they often have sensors that will report the phone's orientation and when it changes (which is used for things like 'wake up the screen when you pick up the phone'). One of the uses for these sensors is for little convenience applications, such as a "Level" app that uses the available sensors to report when the phone is level so you can use it as a level, sometimes for trivial purposes.
For years, this application seemed pretty trivial and obvious to me, with the only somewhat complex bit being figuring out how the person is holding the phone to determine which sort of level they wanted and then adjusting the display to clearly reflect that (while keeping it readable, something that Apple's current efforts partially fail). Then I had a realization:
Today's random thought: Your phone, like mine, probably has a "Level" app, which is most naturally used with the phone on its side for better accuracy, including resting on top of (or below) things. Your phone (also like mine) probably has buttons on the sides that make its sides not 100% straight and level end to end (because the buttons make bumps). So, how does the Level app deal with that? Does it have a range of 'close enough to level', or some specific compensation, or button detection?
(By 'on its side' I meant with the long side of the phone, as opposed to the top or the bottom, which are often flat and button-less. You can also use the phone as a level horizontally, on top of a flat surface, where you have the bump of the camera lenses to worry about.)
My current phone has a noticeable camera bump, and the app I use to get relatively raw sensor data suggests that there's a detectable, roughly 1.5 degree difference in tilt between resting all of the phone on a surface and just having the phone case edge around the camera bump on the surface (which should make the phone as 'level' as possible). However, once it's reached a horizontal '0 degrees' level, the "Level" app will treat both of them as equivalent (I can tilt the phone back and forth without disturbing the green level marking). This isn't just the Level app being deliberately imprecise; before I achieve a horizontal 0 degrees level, the "Level" app does respond to tilting the phone back and forth, typically changing its tilt reading by a degree.
(Experimentation suggests that the side buttons create less tilt, probably under a degree, and also that the Level app probably ignores that tilt when it's reached 0 degrees of tilt. It may ignore such small changes in tilt in general, and there's certainly some noise in the sensor readings.)
As a system administrator and someone who peers into technology for fun, I'm theoretically well aware that often there's more behind the scenes than is obvious. But still, it can surprise me when I notice an aspect of something I've been using for years without thinking about it. There's a lot of magic that goes into making things work the way we expect them to (for example, digital microwaves doing what you want with time; this Level app behavior also sort of falls under the category of 'good UI').
I've written recently on why source packages are complicated and why packages should be declarative (in contrast to Arch style shell scripts), but I haven't said anything about what I'd like in a source package format, which will mostly be from the perspective of a system administrator who sometimes needs to modify upstream packages or package things myself.
A source package format is a compromise. After my recent experiences with dgit, I now feel that the best option is that a source package is a VCS repository directory tree (Git by default) with special control files in a subdirectory. Normally this will be the upstream VCS repository with packaging control files and any local changes merged in as VCS commits. You perform normal builds in this checked out repository, which has the advantage of convenience and the disadvantage that you have to clean up the result, possibly with liberal use of 'git clean' and 'git reset'. Hermetic builds are done by some tool that copies the checked out files to a build area, or clones the repository, or some other option. If a binary package is built in an environment where this information is available, its metadata should include the exact current VCS commit it was built from, and I would make binary packages not build if there were uncommitted changes.
(Making the native source package a VCS tree with all of the source code makes it easy to work on but mingles package control files with the program source. In today's environment with good distributed VCSes I think this is the right tradeoff.)
The control files should be as declarative as possible, and they should directly express major package metadata such as version numbers (unlike the Debian package format, where the version number is derived from debian/changelog). There should be a changelog but it should be relatively free-form, like RPM changelogs. Changelogs are especially useful for local modifications because they go along with the installed binary package, which means that you can get an answer to 'what did we change in this locally modified package' without having to find your source. The main metadata file that controls everything should be kept simple; I would go as far as to say it should have a format that doesn't allow for multi-line strings, and anything that requires multi-line strings should go in additional separate files (including the package description). You could make it TOML but I don't think you should make it YAML.
Both the build time actions, such as configuring and compiling the source, and the binary package install time actions should by default be declarative; you should be able to say 'this is an autoconf based program and it should have the following additional options', and the build system will take care of everything else. Similarly you should be able to directly express that the binary package needs certain standard things done when it's installed, like adding system users and enabling services. However, this will never be enough so you should also be able to express additional shell script level things that are done to prepare, build, install, upgrade, and so on the package. Unlike RPM and Debian source packages but somewhat like Arch packages, these should be separate files in the control directory, eg 'pkgmeta/build.sh'. Making these separate files makes it much easier to do things like run shellcheck on them or edit them in syntax-aware editor environments.
(It should be possible to combine standard declarative prepare and build actions with additional shell or other language scripting. We want people to be able to do as much as possible with standard, declarative things. Also, although I used '.sh', you should be able to write these actions in other languages too, such as Python or Perl.)
I feel that like RPMs, you should have to at least default to explicitly declaring what files and directories are included in the binary package. Like RPMs, these installed files should be analyzed to determine the binary package dependencies rather than force you to try to declare them in the (source) package metadata (although you'll always have to declare build dependencies in the source package metadata). Like build and install scripts, these file lists should be in separate files, not in the main package metadata file. The RPM collection of magic ways to declare file locations is complex but useful so that, for example, you don't have to keep editing your file lists when the Python version changes. I also feel that you should have to specifically mark files in the file lists with unusual permissions, such as setuid or setgid bits.
The natural way to start packing something new in this system would be to clone its repository and then start adding the package control files. The packaging system could make this easier by having additional tools that you ran in the root of your just-cloned repository and looked around to find indications of things like the name, the version (based on repository tags), the build system in use, and so on, and then wrote out preliminary versions of the control files. More tools could be used incrementally for things like generating the file lists; you'd run the build and 'install' process, then have a tool inventory the installed files for you (and in the process it could recognize places where it should change absolute paths into specially encoded ones for things like 'the current Python package location').
This sketch leaves a lot of questions open, such as what 'source packages' should look like when published by distributions. One answer is to publish the VCS repository but that's potentially quite heavyweight, so you might want a more minimal form. However, once you create a 'source only' minimal form without the VCS history, you're going to want a way to disentangle your local changes from the upstream source.
A commentator on my entry on why Debian and RPM (source) packages are complicated suggested looking at Arch Linux packaging, where most of the information is in a single file as more or less a shell script (example). Unfortunately, I'm not a fan of this sort of shell script or shell script like format, ultimately because it's only declarative by convention (although I suspect Arch enforces some of those conventions). One reason that declarative formats are important is that you can analyze and understand what they do without having to execute code. Another reason is that such formats naturally standardize things, which makes it much more likely that any divergence from the standard approach is something that matters, instead of a style difference.
Being able to analyze and manipulate declarative (source) packaging is useful for large scale changes within a distribution. The RPM source package format uses standard, more or less declarative macros to build most software, which I understand has made it relatively easy to build a lot of software with special C and C++ hardening options. You can inject similar things into a shell script based environment, but then you wind up with ad-hoc looking modifications in some circumstances, as we see in the Dovecot example.
Some things about declarative source packages versus Arch style minimalism are issues of what could be called 'hygiene'. RPM packages push you to list and categorize what files will be included in the built binary package, rather than simply assuming that everything installed into a scratch hierarchy should be packaged. This can be frustrating (and there are shortcuts), but it does give you a chance to avoid accidentally shipping unintended files. You could do this with shell script style minimal packaging if you wanted to, of course. Both RPM and Debian packages have standard and relatively declarative ways to modify a pristine upstream package, and while you can do that in Arch packages, it's not declarative, which hampers various sorts of things.
Basically my feeling is that at scale, you're likely to wind up with something that's essentially as formulaic as a declarative source package format without having its assured benefits. There will be standard templates that everyone is supposed to follow and they mostly will, and you'll be able to mostly analyze the result, and that 'mostly' qualification will be quietly annoying.
(On the positive side, the Arch package format does let you run shellcheck on your shell stanzas, which isn't straightforward to do in the RPM source format.)
Recently I read Lorin Hochstein's The dangers of SSL certificates (via, among others), which talks about a Bazel build workflow outage caused by an expired TLS certificate. I had some direct reactions to this but after thinking about it I want to step back and say that in general, it's clear that expiry times are dangerous, often more or less regardless of where they appear. TLS certificate expiry times are an obvious and commonly encountered instance of expiry times in cryptography, but TLS certificates aren't the only case; in 2019, Mozilla had an incident where the signing key for Firefox addons expired (I believe the system used certificates, but not web PKI TLS certificates). Another thing that expires is DNS data (not just DNSSEC keys) and there have been incidents where expiring DNS data caused problems. Does a system have caches with expiry times? Someone has probably had an incident where things expired by surprise.
One of the problems with expiry times in general is that they're usually implemented as an abrupt cliff. On one side of the expiry time everything is fine and works perfectly, and one second later on the other side of the expiry time everything is broken. There's no slow degradation, no expiry equivalent of 'overload', and so on, which means that there's nothing indirect to notice and detect in advance. You must directly check and monitor the expiry time, and if you forget, things explode. We're fallible humans so we forget every so often.
This abrupt cliff of failure is a technology choice. In theory we could begin degrading service some time before the expiry time, or we could allow some amount of success for a (short) time after the expiry time, but instead we've chosen to make things be a boolean choice (which has made time synchronization across the Internet increasingly important; your local system can no longer be all that much out of step with Internet time if things are to work well). This is especially striking because expiry times are most often a heuristic, not a hard requirement. We add expiry times to limit hypothetical damage, such as silent key compromise, or constrain how long out of data DNS data is given to people, or similar things, but we don't usually have particular knowledge that the key or data cannot and must not be used after a specific time (for example, because the data will definitely have changed at that point).
(Of course the mechanics of degrading the service around the expiry time are tricky, especially in a way that the service operator would notice or get reports about.)
Another problem, related to the abrupt cliff, is that generally expiry times are invisible or almost invisible. Most APIs and user interfaces don't really surface the expiry time until you fall over the cliff; generally you don't even get warnings logged that an expiry time is approaching (either in clients or in servers and services). We implicitly assume that expiry times will never get reached because something will handle the situation before then. Invisible expiry times are fine if they're never reached, but if they're hit as an abrupt cliff you have the worst of two worlds. Again, this isn't a simple problem with an obvious solution; for example, you might need things to know or advertise what is a dangerously close expiry time (if you report the expiry time all of the time, it becomes noise that is ignored; that's already effectively the situation with TLS certificates, where tools will give you all the notAfter dates you could ask for and no one bothers looking).
Some protocols do without expiry times entirely; SSH keypairs are one example (unless you use SSH certificates, but even then the key that signs certificates has no expiry). This has problems and risks that make it not suitable for all environments. If you're working in an environment that has and requires expiry times, another option is to simply set them as far in the future as possible. If you don't expect the thing to ever expire and have no process for replacing it, don't set its expiry time to ten years. But not everything can work this way; your DNS entries will change sooner or later, and often in much less than ten years.
A commentator on my early notes on dgit mentioned that they found packaging in Debian overly complicated (and I think perhaps RPMs as well) and would rather build and ship a container. On the one hand, this is in a way fair; my impression is that the process of specifying and building a container is rather easier than for source packages. On the other hand, Debian and RPM source packages are complicated for good reasons.
Any reasonably capable source package format needs to contain a number of things. A source package needs to supply the original upstream source code, some amount of distribution changes, instructions for building and 'installing' the source, a list of (some) dependencies (for either or both build time and install time), a list of files and directories it packages, and possibly additional instructions for things to do when the binary package is installed (such as creating users, enabling services, and so on). Then generally you need some system for 'hermetic' builds, ones that don't depend on things in your local (Linux) login environment. You'll also want some amount of metadata to go with the package, like a name, a version number, and a description. Good source package formats also support building multiple binary packages from a single source package, because sometimes you want to split up the built binary files to reduce the amount of stuff some people have to install. A built binary package contains a subset of this; it has (at least) the metadata, the dependencies, a file list, all of the files in the file list, and those install and upgrade time instructions.
Built containers are a self contained blob plus some metadata. You don't need file lists or dependencies or install and removal actions because all of those are about interaction with the rest of the system and by design containers don't interact with the rest of the system. To build a container you still need some of the same information that a source package has, but you need less and it's deliberately more self-contained and freeform. Since the built container is a self contained artifact you don't need a file list, I believe it's uncommon to modify upstream source code as part of the container build process (instead you patch it in advance in your local repository), and your addition of users, activation of services, and so on is mostly free form and at container build time; once built the container is supposed to be ready to go. And my impression is that in practice people mostly don't try to do things like multiple UIDs in a single container.
(You may still want or need to understand what things you install where in the container image, but that's your problem to keep track of; the container format itself only needs a little bit of information from you.)
Containers have also learned from source packages in that they can be layered, which is to say that you can build your container by starting from some other container, either literally or by sticking another level of build instructions on the end. Layered source packages don't make any sense when you're thinking like a distribution, but they make a lot of sense for people who need to modify the distribution's source packages (this is what dgit makes much easier, partly because Git is effectively a layering system; that's one way to look at a sequence of Git commits).
(My impression of container building is that it's a lot more ad-hoc than package building. Both Debian and RPM have tried to standardize and automate a lot of the standard source code building steps, like running autoconf, but the cost of this is that each of them has a bespoke set of 'convenient' automation to learn if you want to build a package from scratch. With containers, you can probably mostly copy the upstream's shell-based build instructions (or these days, their Dockerfile).)
Dgit based building of (potentially modified) Debian packages can be surprisingly close to the container building experience. Like containers, you first prepare your modifications in a repository and then you run some relatively simple commands to build the artifacts you'll actually use. Provided that your modifications don't change the dependencies, files to be packaged, and so on, you don't have to care about how Debian defines and manipulates those, plus you don't even need to know exactly how to build the software (the Debian stuff takes care of that for you, which is to say that the Debian package builders have already worked it out).
In general I don't think you can get much closer to the container build experience other than the dgit build experience or the general RPM experience (if you're starting from scratch). Packaging takes work because packages aren't isolated, self contained objects; they're objects that need to be integrated into a whole system in a reversible way (ie, you can uninstall them, or upgrade them even though the upgraded version has a somewhat different set of files). You need more information, more understanding, and a more complicated build process.
(Well, I suppose there are flatpaks (and snaps). But these mostly don't integrate with the rest of your system; they're explicitly designed to be self-contained, standalone artifacts that run in a somewhat less isolated environment than containers.)
This is my angry face that GNU Emacs appears to have re-indented my entire Python file to a different standard without me noticing and I didn't catch it in time. And also it appears impossible in GNU Emacs to FIX this. I do not want four space no tabs, this is historical code that all files should be eight spaces with tabs (yes, Python 2).
That 'Python 2' bit turns out to be load-bearing. The specific problem turned out to be that if I hit TAB with a region selected or M-q when GNU Emacs point was outside a comment, the entire file was reformatted to modern 4-space indents (and long expressions got linewrapped, and some other formatting changes). I'm not sure which happened to trigger the initial reformatting that I didn't notice in time, but I suspect I was trying to use M-q to reflow a file level comment block and had my cursor (point) in the wrong spot. My TAB and M-q bindings are standard, and when I investigated deeply enough I discovered that this was LSP related.
The first thing I learned is that just 'turning off' LSP mode with
'lsp-mode' (or 'M-: (lsp-mode -1))' isn't enough to actually turn
off LSP based indentation handling. This is discussed in lsp-mode
issue #824, and
apparently the solution is some combination of deactivating an
additional minor mode, invoking lsp-disconnect through M-x (or
using the 's-l w D' key binding if you have Super available), or
setting lsp-enable-indentation to 'nil' (probably as a buffer-local
variable, although tastes may differ).
The second thing I discovered is that in my environment this doesn't happen for Python 3 code. With my normal Python 3 GNU Emacs LSP environment, using python-lsp-server (pylsp) (also), the LSP environment will make no changes and report 'No formatting changes provided'. My problem only happens in Python 2 buffers, and that's because in Python 2 buffers I wasn't using pylsp (which only officially supports Python 3 code) but instead the older and now unsupported pyls. Either pyls has always behaved differently than pylsp when the LSP server asks it to do formatting stuff, or at some point the LSP protocol and expectations around formatting actions changed and pyls (which has been unmaintained since 2020) didn't change to keep up.
My immediate fix was to set lsp-enable-indentation to nil in my
GNU Emacs lsp-mode hook for python-mode. As a longer term thing I'm
going to experiment with using pylsp even for Python 2 code, to see
how it goes. Otherwise I may wind up disabling LSP for Python 2
code and buffers, although that's somewhat tricky since there's no
explicit separate settings for Python 2 versus Python 3. Another
immediate fix is that in the future I may be editing this particular
code base more in vi(m) or perhaps sam
than GNU Emacs.
(My Python 2 code is mostly or entirely written using tabs for indentation, so the presence of leading tabs is a reliable way of detecting 'Python 2' code.)
PS: This particular Python 2 program is DWiki, the wiki engine underlying Wandering Thoughts, so while it will move to Python 3 someday and I once got a hacked version vaguely running that way, it's not going to happen any time soon for multiple reasons.
Over on the Fediverse, I shared an old story that's partly about (system) documentation, and it sparked a thought, which is that we (I) should write up a brief high level overview of our overall environment. This should probably be one level higher than an end of service writeup, which are focused on a specific service (if we write them at all). The reason to do this is because our regular documentation assumes a lot of context and part of that context is what our overall environment is. We know what the environment is because it's the water we work in, but a new person arriving here could very easily be lost.
What I'm thinking of is something as simple as saying (in a bit more words) that we store our data on a bunch of NFS fileservers and people get access to their home directories and so on by logging in to various multi-user Unix servers that all run Ubuntu Linux, or using various standard services like email (IMAP and webmail), Samba/CIFS file access, and printing. Our logins and passwords are distributed around as files from a central password server and a central NFS-mounted filesystem. There's some more that I would write here (including information about our networks) and I'd probably put in a bit more details about some names of the various servers and filesystems, but not too much more.
(At least not in the front matter. Obviously such an overview could get increasingly detailed in later sections.)
A bunch of this information is already on our support website in some form, but I feel the support website is both too detailed and not complete enough. It's too detailed because it's there to show people how to do things, and it's not complete because we deliberately omit some things that we consider implementation details (such as our NFS fileservers). A new person here should certainly read all the way through the support site sooner or later, but that's a lot of information to absorb. A high level overview is a quick start guide that's there to orient people and leave them with fewer moments of 'wait, you have a what?' or 'what is this even talking about?' as they're exposed to our usual documentation.
One reason to keep the high level overview at a high level is that the less specific it is, the less it's going to fall out of date as things change. Updating such a high level overview is always going to be low on the priority list, since it's almost never used, so the less updating it needs the better. Also, I can also write somewhat more detailed high level overviews of specific aspects or sub-parts of our environment, if I find myself feeling that the genuine high level version doesn't say enough. Another reason to keep it high level is to keep it short, because asking a new person to read a couple of pages (at most) as high level orientation is a lot better than throwing them into the deep end with dozens of pages and thousands of words.
(I'm writing this down partly to motivate myself to do this when we go back to work in the new year, even though it feels both trivial and obvious. I have to remind myself that the obvious things about our environment to me are that way partly because I'm soaking in it.)
A while back, Chrome proposed and implemented what are called user agent hints, which are a collection of Sec-CH-UA HTTP headers that can provide you with additional information about the browser beyond what the HTTP User-Agent header provides. As mentioned, only Chrome and browsers derived from Chromium (or if you prefer, 'Blink') support these headers, and only since early 2021 (for Chrome; later for some others). However, Chrome is what a lot of people use. More to the point, Chrome is what a lot of bad crawlers claim to be in their User-Agent header. As has been written up by other people, you can use these headers to detect inconsistencies that give away crawlers.
In an ideal world, it would be enough to detect a recent enough Chrome version and then require it to be consistent between the User-Agent, the platform from Sec-CH-UA-Platform, and the version information from Sec-CH-UA. We don't live in an ideal world. The first issue is that some versions of Chrome don't send these user agent hints by default (I've seen this specifically from Android Pixel devices). To get them to do so, you must reply with a HTTP 307 redirection that includes Accept-CH and Critical-CH headers for the Sec-CH-UA headers you care about. I'm not sure if you can redirect the browser to the current URL; I opt to redirect to the URL with a special query parameter added, which then redirects back to the original version of the URL.
(One advantage of this is that in my HTTP request handling, I can reject a request with the special query parameter if it still doesn't including the Sec-CH-UA headers I ask for. This avoids infinite redirect loops and lets me log definite failures. Chrome browser setups that refuse to provide them even when requested are currently redirected to an error page explaining the situation.)
Cross checking the browser version from Sec-CH-UA against the 'browser version' in the User-Agent is complicated by the question of what is a browser version. This is especially the case because the 'brand names' used in Sec-CH-UA aren't necessarily the '<whatever>/<ver>' names used in the User-Agent; for example, Microsoft Edge will report itself as 'Microsoft Edge' in Sec-CH-UA but 'Edg/' in the User-Agent. Some browsers based on Chrome will report a Chrome version that is the same as their brand name version (this appears to be true for Edge, for example), but others definitely won't, so you may need a mapping table from brand name to User-Agent name if you want to go that far. Sometimes the best you can do is verify the claimed 'Chromium' version against the 'Chrome/' version from the User-Agent.
Platform names definitely require a mapping from the Sec-CH-UA-Platform value to what appears in the User-Agent. On top of that, sometimes browsers will change their User-Agent platform name without changing Sec-CH-UA-Platform. One case I know of is that some versions of Android Opera (and perhaps Chrome) will change their User-Agent to say they're on Linux if you have them ask for the 'desktop' version of a site, but still report the Android values in their Sec-CH-UA headers (and say that they aren't a mobile device in Sec-CH-UA-Mobile, which is fair enough). It's hard to object to this behavior in a world where User-Agent sniffing is one way that websites decide on regular versus 'mobile' versions.
My use of Sec-CH-UA checks so far here on Wandering Thoughts has turned up several sorts of bad behavior in crawlers (so far). As I sort of expected, the most common behavior is crawlers that claim to be Chrome in their User-Agent (or something derived from it) but don't supply any Sec-CH-UA headers; this is now a straightforward bad idea even if you mention your crawler in your User-Agent. Some crawlers report one Chrome version in Sec-CH-UA but another one in their User-Agent, usually with the User-Agent version being older. I suspect that these crawlers are based on Chromium and periodically update their Chromium version, but statically configure their User-Agent and don't update it. Some of these crawlers also report a different platform between Sec-CH-UA-Platform and their User-Agent (so far all of them have been running on macOS but saying they were Windows 10 or 11 machines in their User-Agent). The third case is things that report they are headless Chrome in their Sec-CH-UA header (and I reject them).
(This is where the Internet Archive gets a dishonorable mention; currently their crawling often has mismatched User-Agent and Sec-CH-UA headers. Sometimes they have a special marker in the User-Agent and sometimes it's just mismatched Chrome information.)
I've also seen some weird cases so far where a crawler provided Sec-CH-UA headers despite claiming to be Firefox in its User-Agent. My data so far is incomplete, but some of these have had mismatches between Sec-CH-UA-Platform and the User-Agent, while another claimed to be Chrome 88 (which in theory is before Chrome supported them) while saying it was Firefox 120 in its User-Agent. I've improved my logging and error reporting so I may get slightly better data on this in a while.
At the same time, checking Sec-CH-UA headers (and checking them against User-Agent headers) will definitely not defeat all bad crawlers. Some crawlers are clearly using either real browsers or software that fakes everything together properly. I suspect the latter because the most recent case involves a horde of IPs claiming to be Chrome 142 on macOS 10.15.7, which I doubt is so universal a configuration (especially on datacenter VPSes and servers). As with email spam, all of this is a constant race of heuristics against the bad actors.
(It's hard to judge my new Sec-CH-UA checks compared to my existing header checks because of check ordering. If I was sufficiently energetic I'd try to do all of the checks before rejecting anything and log all failed checks, but as it is I do checks one by one and reject (or redirect with Critical-CH) at the first failed one.)
Suppose, not entirely hypothetically, that you've made local changes to an Ubuntu package on one Ubuntu release, such as 22.04 ('jammy'), and now you want to move to another Ubuntu release such as 24.04 ('noble'). If you're working with straight 'apt-get source' Ubuntu source packages, this is done by tediously copying all of your patches over (hopefully the package uses quilt) to duplicate and recreate your 22.04 work.
If you're using dgit, this is much easier. Partly this is because dgit is based on Git, but partly this is because dgit has an extremely convenient feature where it can have several different releases in the same Git repository. So here's what we want to do, assuming you have a dgit repository for your package already.
(For safety you may want to do this in a copy of your repository. I make rsync'd copies of Git repositories all the time for stuff like this.)
Our first step is to fetch the new 24.04 ('noble') version of the package into our dgit repository as a new dgit branch, and then check out the branch:
dgit fetch -d ubuntu noble,-security,-updatesdgit checkout noble,-security,-updates
We could do this in one operation but I'd rather do it in two, in case there are problems with the fetch.
The Git operation we want to do now is to cherry-pick (also) our changes to the 22.04 version of the package onto the 24.04 version of the package. If this goes well the changes will apply cleanly and we're done. However, there is a complication. If we've followed the usual process for making dgit-based local changes, the last commit on our 22.04 version is an update to debian/changelog. We don't want that change, because we need to do our own 'gbp dch' on the 24.04 version after we've moved our own changes over to make our own 24.04 change to debian/changelog (among other things, the 22.04 changelog change has the wrong version number for the 24.04 package).
In general, cherry-picking all our local changes is 'git cherry-pick old-upstream..old-local'. To get all but the last change, we want 'old-local~' instead. Dgit has long and somewhat obscure branch names; its upstream for our 22.04 changes is 'dgit/dgit/jammy,-security,-updates' (ie, the full 'suite' name we had to use with 'dgit clone' and 'dgit fetch'), while our local branch is 'dgit/jammy,-security,-updates'. So our full command, with a 'git log' beforehand to be sure we're getting what we want, is:
git log dgit/dgit/jammy,-security,-updates..dgit/jammy,-security,-updates~git cherry-pick dgit/dgit/jammy,-security,-updates..dgit/jammy,-security,-updates~
(We've seen this dgit/dgit/... stuff before when doing 'gbp dch'.)
Then we need to make our debian/changelog update. Here, as an important safety tip, don't blindly copy the command you used while building the 22.04 package, using 'jammy,...' in the --since argument, because that will try to create a very confused changelog of everything between the 22.04 version of the package and the 24.04 version. Instead, you obviously need to update it to your new 'noble' 24.04 upstream, making it:
gbp dch --since dgit/dgit/noble,-security,-updates --local .cslab. --ignore-branch --commit
('git reset --hard HEAD~' may be useful if you make a mistake here. As they say, ask me how I know.)
If the cherry-pick doesn't apply cleanly, you'll have to resolve that yourself. If the cherry-pick applies cleanly but the result doesn't build or perhaps doesn't work because the code has changed too much, you'll be using various ways to modify and update your changes. But at least this is a bunch easier than trying to sort out and update a quilt-based patch series.
Based on this conversation, if Ubuntu releases a new version of the package, what I think I need to do is to use 'dgit fetch' and then explicitly rebase:
dgit fetch -d ubuntu
You have to use '-d ubuntu' here or 'dgit fetch' gets confused and fails. There may be ways to fix this with git config settings, but setting them all is exhausting and if you miss one it explodes, so I'm going to have to use '-d ubuntu' all the time (unless dgit fixes this someday).
Dgit repositories don't have an explicit Git upstream set, so I don't think we can use plain rebase. Instead I think we need the more complicated form:
git rebase dgit/dgit/jammy,-security,-updates dgit/jammy,-security,-updates
(Until I do it for real, these arguments are speculative. I believe they should work if I understand 'git rebase' correctly, but I'm not completely sure. I might need the full three argument form and to make the 'upstream' a commit hash.)
Then, as above, we need to drop our debian/changelog change and redo it:
git reset --hard HEAD~gbp dch --since dgit/dgit/jammy,-security,-updates --local .cslab. --ignore-branch --commit
(There may be a clever way to tell 'git rebase' to skip the last change, or you can do an interactive rebase (with '-i') instead of a non-interactive one and delete it yourself.)