Reading view

There are new articles available, click to refresh the page.

Web Perf Hero: Máté Szabó

MediaWiki is the platform that powers Wikipedia and other Wikimedia projects. There is a lot of traffic to these sites. We want to serve our audience in a way that they get the best experience and performance possible. So efficiency of the MediaWiki platform is of great importance to us and our readers.

MediaWiki is a relatively large application with 645,000 lines of PHP code in 4,600 PHP files, and growing! (Reported by cloc.) When you have as much traffic as Wikipedia, working on such a project can create interesting problems. 

MediaWiki uses an “autoloader” to find and import classes from PHP files into memory. In PHP, this happens on every single request, as each request gets its own process. In 2017, we introduced support for loading classes from PSR-4 namespace directories (in MediaWiki 1.31). This mechanism involves checking which directory contains a given class definition.

Problem statement

Kunal (@Legoktm) noticed after MediaWiki 1.35, wikis became slower due to spending more time in fstat system calls. Syscalls make a program switch to kernel mode, which is expensive.

We learned that our Autoloader was the one doing the fstat calls, to check file existence. The logic powers the PSR-4 namespace feature, and actually existed before MediaWiki 1.35. But, it only became noticeable after we introduced the HookRunner system, which loaded over 500 new PHP interfaces via the PSR-4 mechanism.

MediaWiki’s Autoloader has a class map array that maps class names to their file paths on disk. PSR-4 classes do not need to be present in this map. Before introducing HookRunner, very few classes in MediaWiki were loaded by PSR-4. The new hook files leveraged PSR-4, exposing many calls to file_exists() for PSR-4 directory searching, in every request. This adds up pretty quickly thereby degrading MediaWiki performance.

See task T274041 on Phabricator for the collaborative investigation between volunteers and staff.

Solution: Optimized class map

Máté Szabó (@TK-999) took a deep dive and profiled a local MediaWiki install with php-excimer and generated a flame graph. He found that about 16.6% of request time was spent in the Autoloader::find() method, which is responsible for finding which file contains a given class.
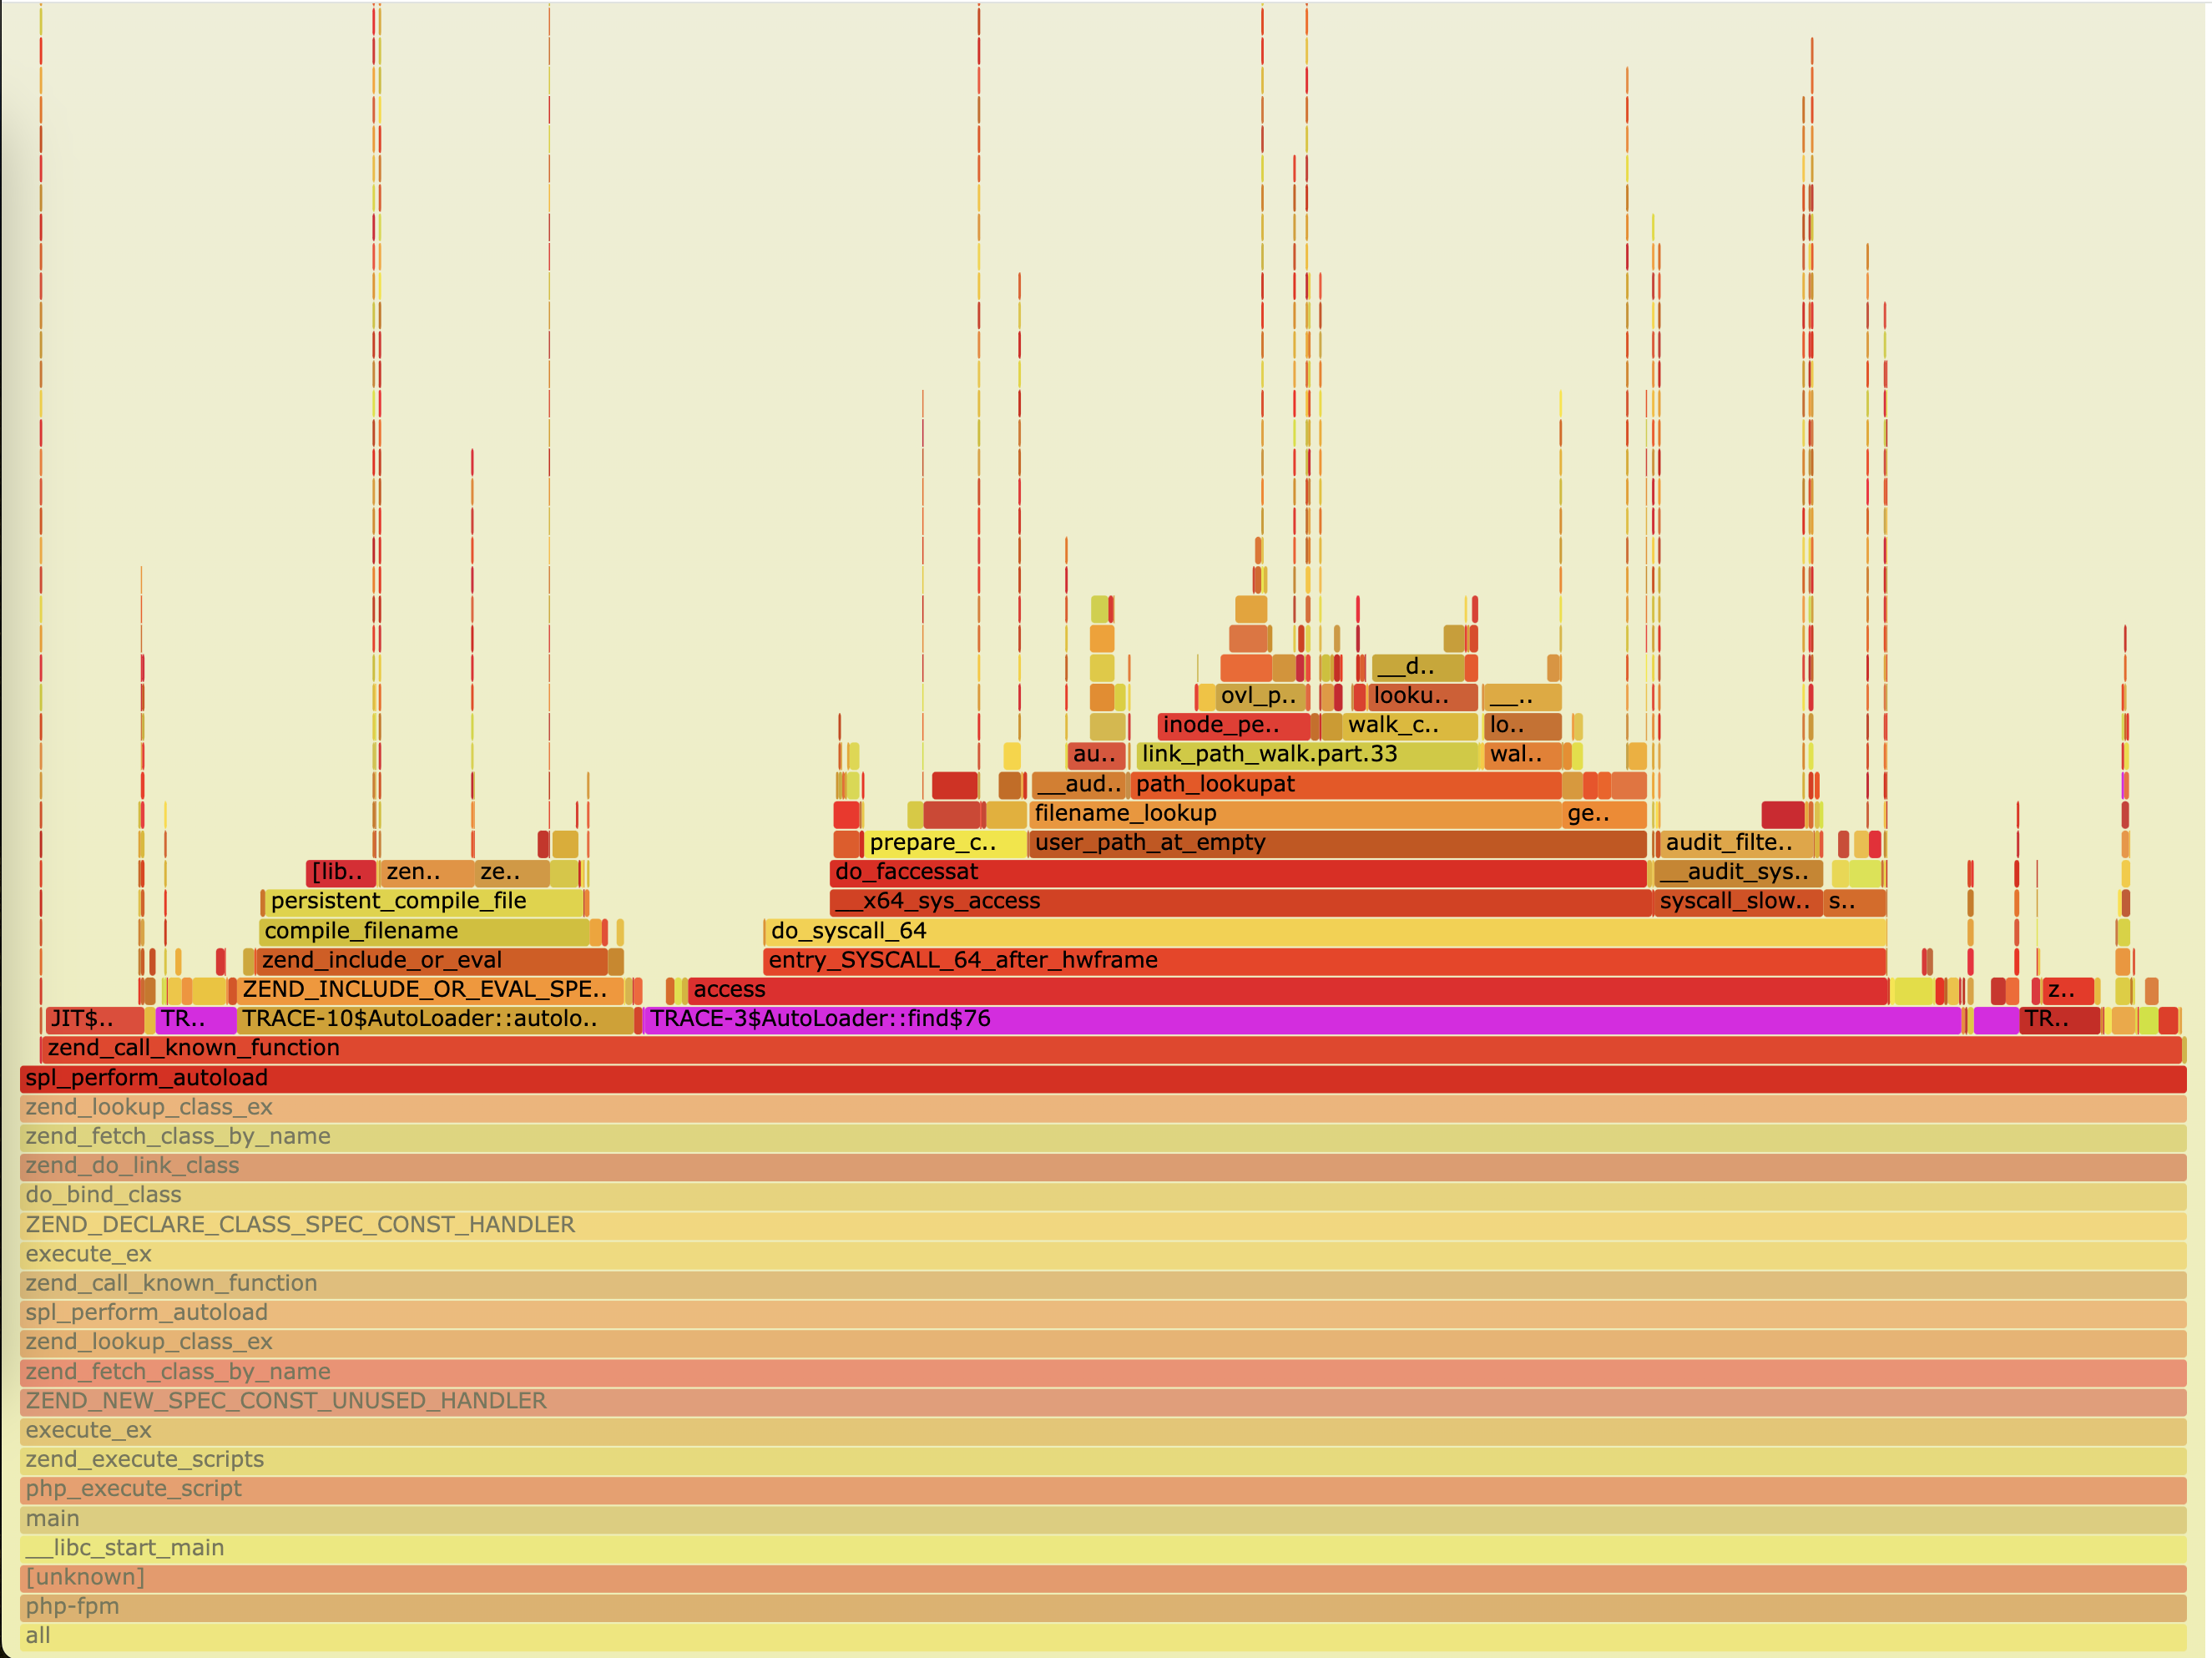
Figure 1: Flame graph by Máté Szabó.

Checking for file existence during PSR-4 autoloading seems necessary because one namespace can correspond to multiple directories that promise to define some of its classes. The search logic has to check each directory until it finds a class file. Only when the class is not not found anywhere may the program crash with a fatal error.

Máté avoided the directory searching cost by expanding MediaWiki’s Autoloader class map to include all classes, including those registered via PSR-4 namespaces. This solution makes use of a hash-map, where each class maps to one and only one file path on disk, making it a 1-to-1 mapping.

This means, the Autoloader::find() method no longer has to search through the PSR-4 directories. It now knows upfront where each class is, by merely accessing the array from memory. This removes the need for file existence checks. This approach is similar to the autoloader optimization flag in Composer.


Impact

Máté’s optimization significantly reduced response time by optimizing the Autoloader::find() method. This is largely due to the elimination of file system calls.

After deploying the change to MediaWiki appservers in production, we saw a major shift in response times toward faster buckets: a ~20% increase in requests completed within 50ms, and a ~10% increase in requests served under 100ms (T274041#8379204).

Máté analyzed the baseline and classmap cases locally, benchmarking 4800 requests, controlled at exactly 40 requests per second. He found latencies reduced on average by ~12%:

Table 1: Difference in latencies between baseline and classmap autoloader.
LatenciesBaselineFull classmap
p50
(mean average)
26.2ms22.7ms (~13.3% faster)
p9029.2ms25.7ms (~11.8% faster)
p9531.1ms27.3ms (~12.3% faster)

We reproduced Máté’s findings locally as well. On the Git commit right before his patch, Autoloader::find() really stands out.
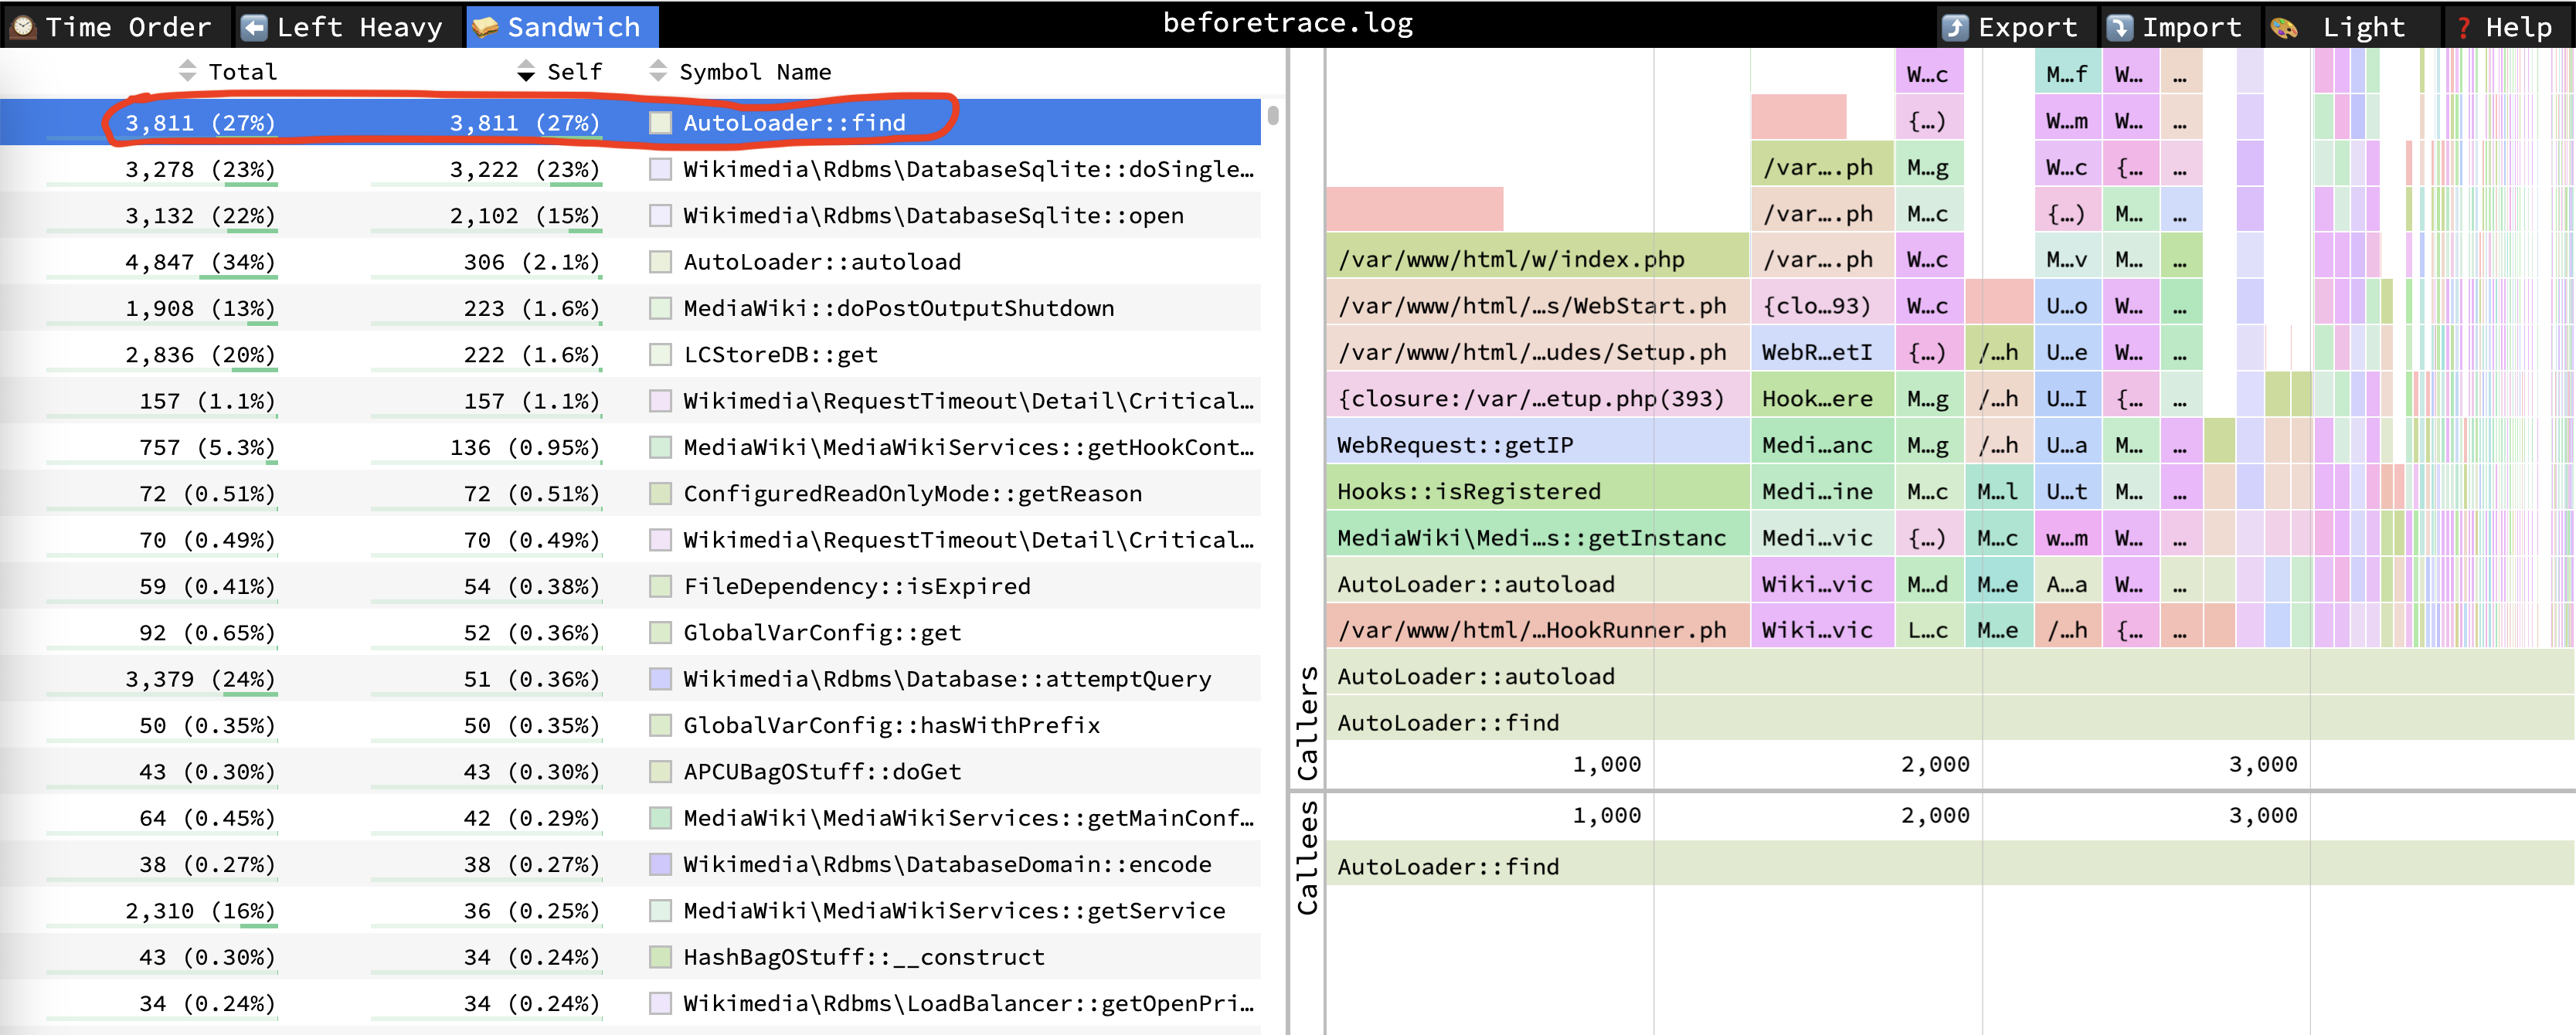
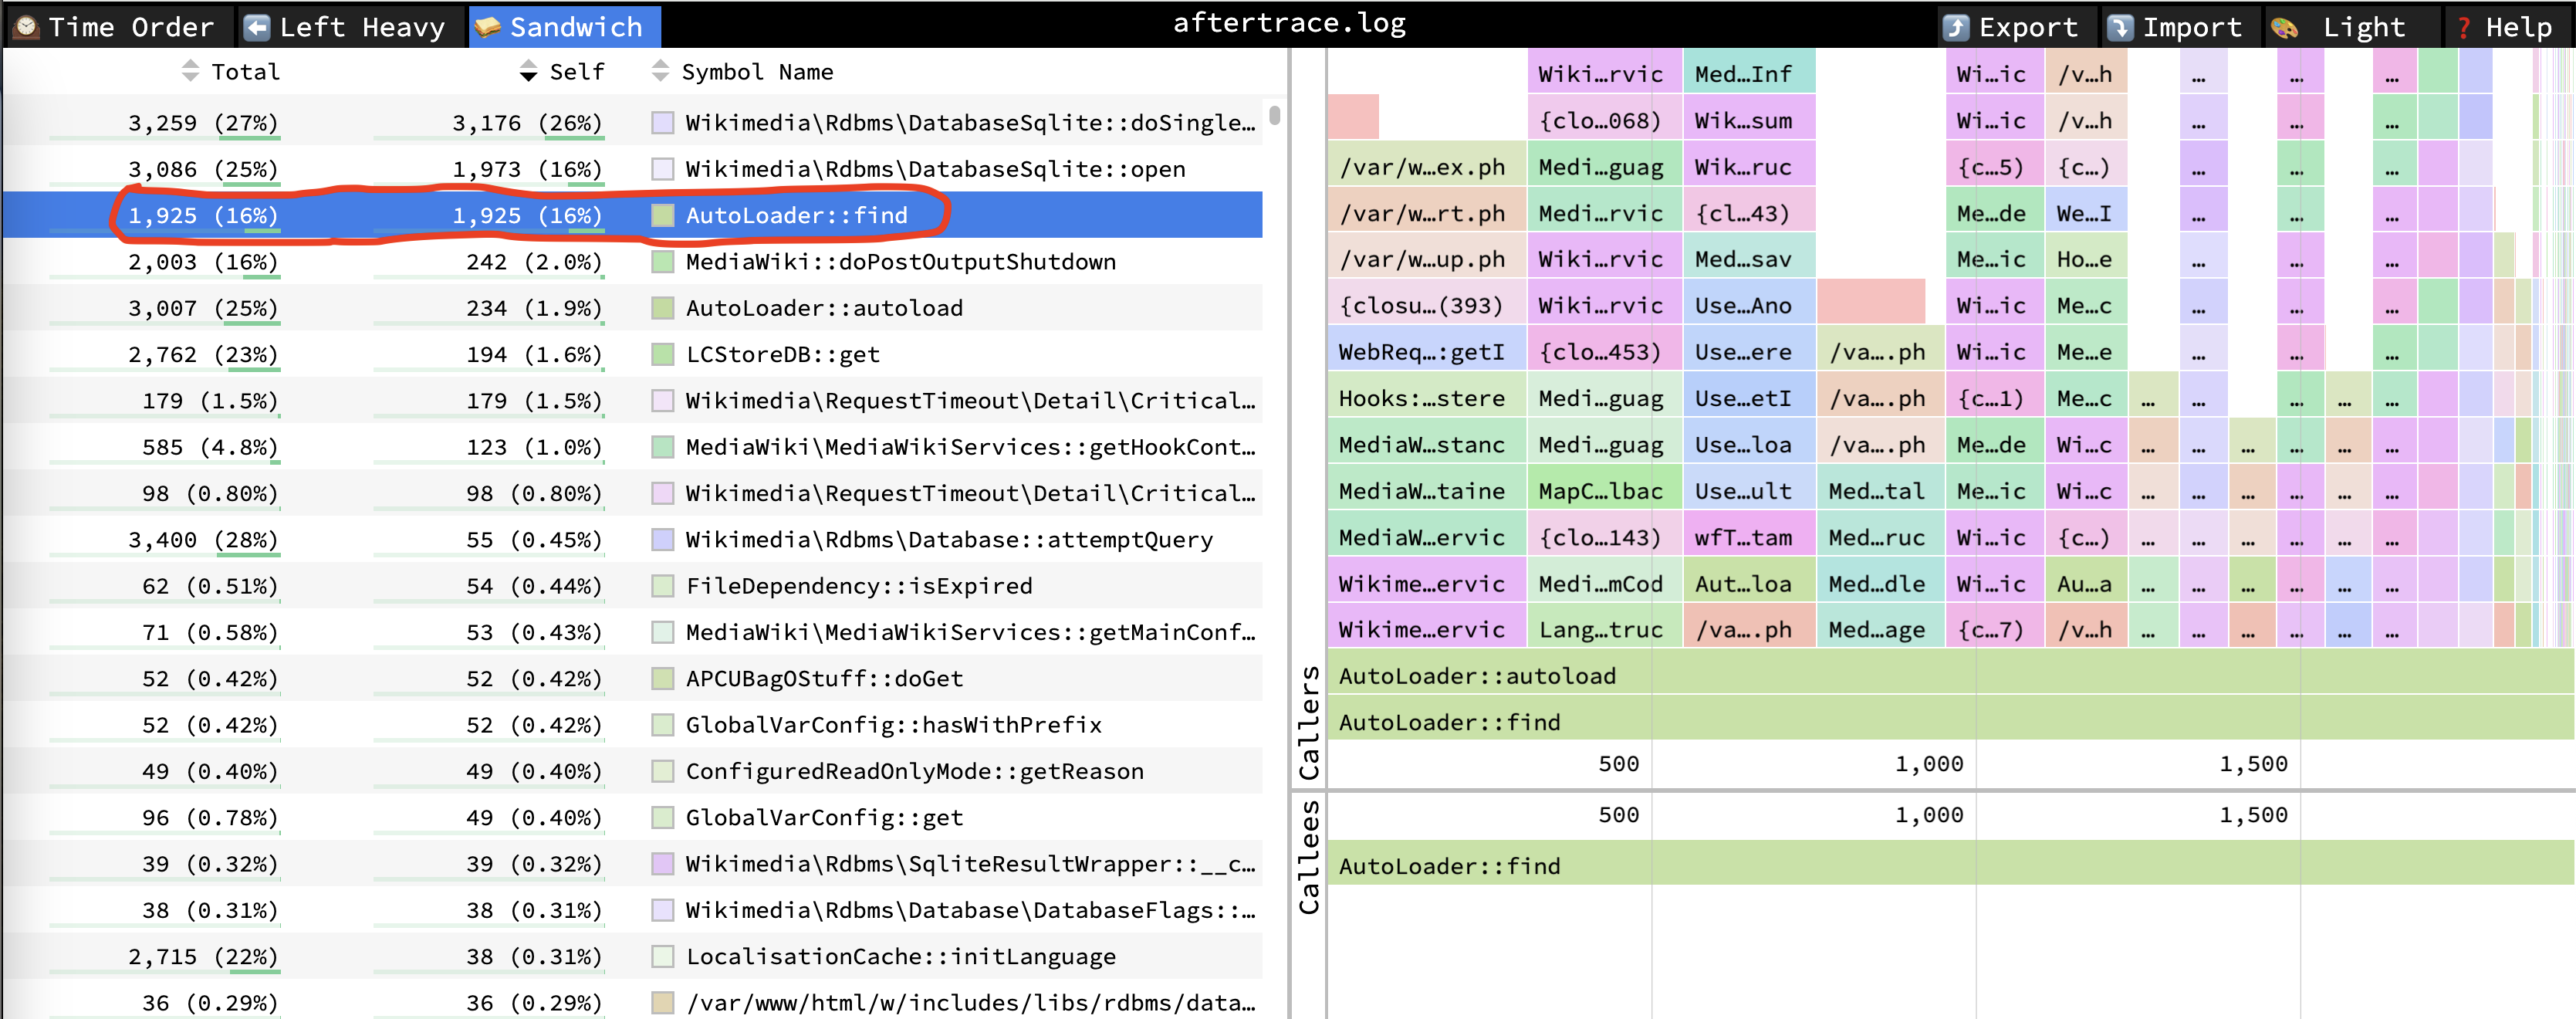
Figure 2: Profile before optimization.
Figure 3: Profile after optimization.

NOTE: We used ApacheBench to load the /wiki/Main_Page URL from a local MediaWiki installation with PHP 8.1 on on Apple M1. We ran it both in a bare metal environment (PHP built-in webserver, 8 workers, no APCU), and in MediaWiki-Docker. We configured our benchmark to run 1000 requests with 7 concurrent requests. The profiles were captured using Excimer with a 1ms interval. The flame graphs were generated with Speedscope, and the box plots were created with Gnuplot.

In Figure 4 and 5, the “After” box plot has a lower median than the “Before” box plot. This means there is a reduction in latency. Also, the standard deviation in the “After” scenario shrunk, which indicates that responses were more consistently fast (not only on average). This increases the percentage of our users that have an experience very close to the average response time of web requests. Fewer users now experience an extreme case of web response slowness.
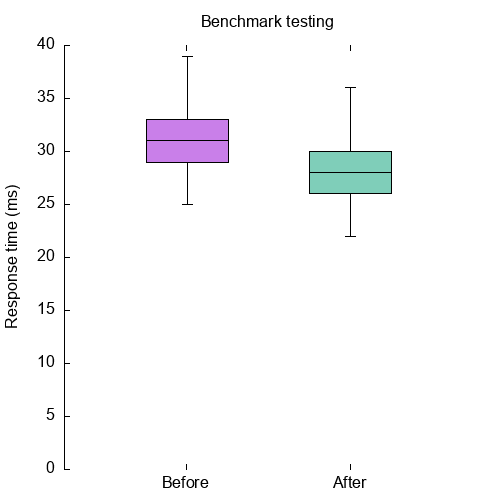
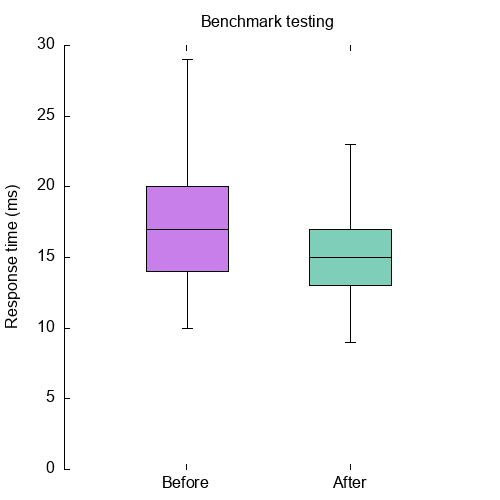
Figure 4: Boxplot for requests on bare metal.
Figure 5: Boxplot for requests on Docker.

Web Perf Hero award

The Web Perf Hero award is given to individuals who have gone above and beyond to improve the web performance of Wikimedia projects. The initiative is led by the Performance Team and started mid-2020. It is awarded quarterly and takes the form of a Phabricator badge.

Read about past recipients at Web Perf Hero award on Wikitech.


Further reading

Flame graphs arrive in WikimediaDebug

The new “Excimer UI” option in WikimediaDebug generates flame graphs. What are flame graphs, and when do you need this?

A flame graph visualizes a tree of function calls across the codebase, and emphasizes the time each function spends. In 2014, we introduced Arc Lamp to help detect and diagnose performance issues in production. Arc Lamp samples live traffic and publishes daily flame graphs. This same diagnostic power is now available on-demand to debug sessions!

Debugging until now

WikimediaDebug is a browser extension for Firefox and Chromium-based browsers. It helps stage deployments and diagnose problems in backend requests. It can pin your browser to a given data center and server, send verbose messages to Logstash, and… capture performance profiles!

Our main debug profiler has been XHGui. XHGui is an upstream project that we first deployed in 2016. It’s powered by php-tideways under the hood, which favors accuracy in memory and call counts. This comes at the high cost of producing wildly inaccurate time measurements. The Tideways data model also can’t represent a call tree, needed to visualize a timeline (learn more, upstream change). These limitations have led to misinterpretations and inconclusive investigations. Some developers work around this manually with time-consuming instrumentation from a production shell. Others might repeatedly try fixing a problem until a difference is noticeable.

Table that lists function names with their call count, memory usage, and estimated runtime.
Screenshot of XHGui.

Accessible performance profiling

Our goal is to lower the barrier to performance profiling, such that it is accessible to any interested party, and quick enough to do often. This includes reducing knowledge barriers (internals of something besides your code), and mental barriers (context switch).

You might wonder (in code review, in chat, or reading a mailing list) why one thing is slower than another, what the bottlenecks are in an operation, or whether some complexity is “worth” it?

With WikimediaDebug, you flip a switch, find out, and continue your thought! It is part of a culture in which we can make things faster by default, and allows for a long tail of small improvements that add up.

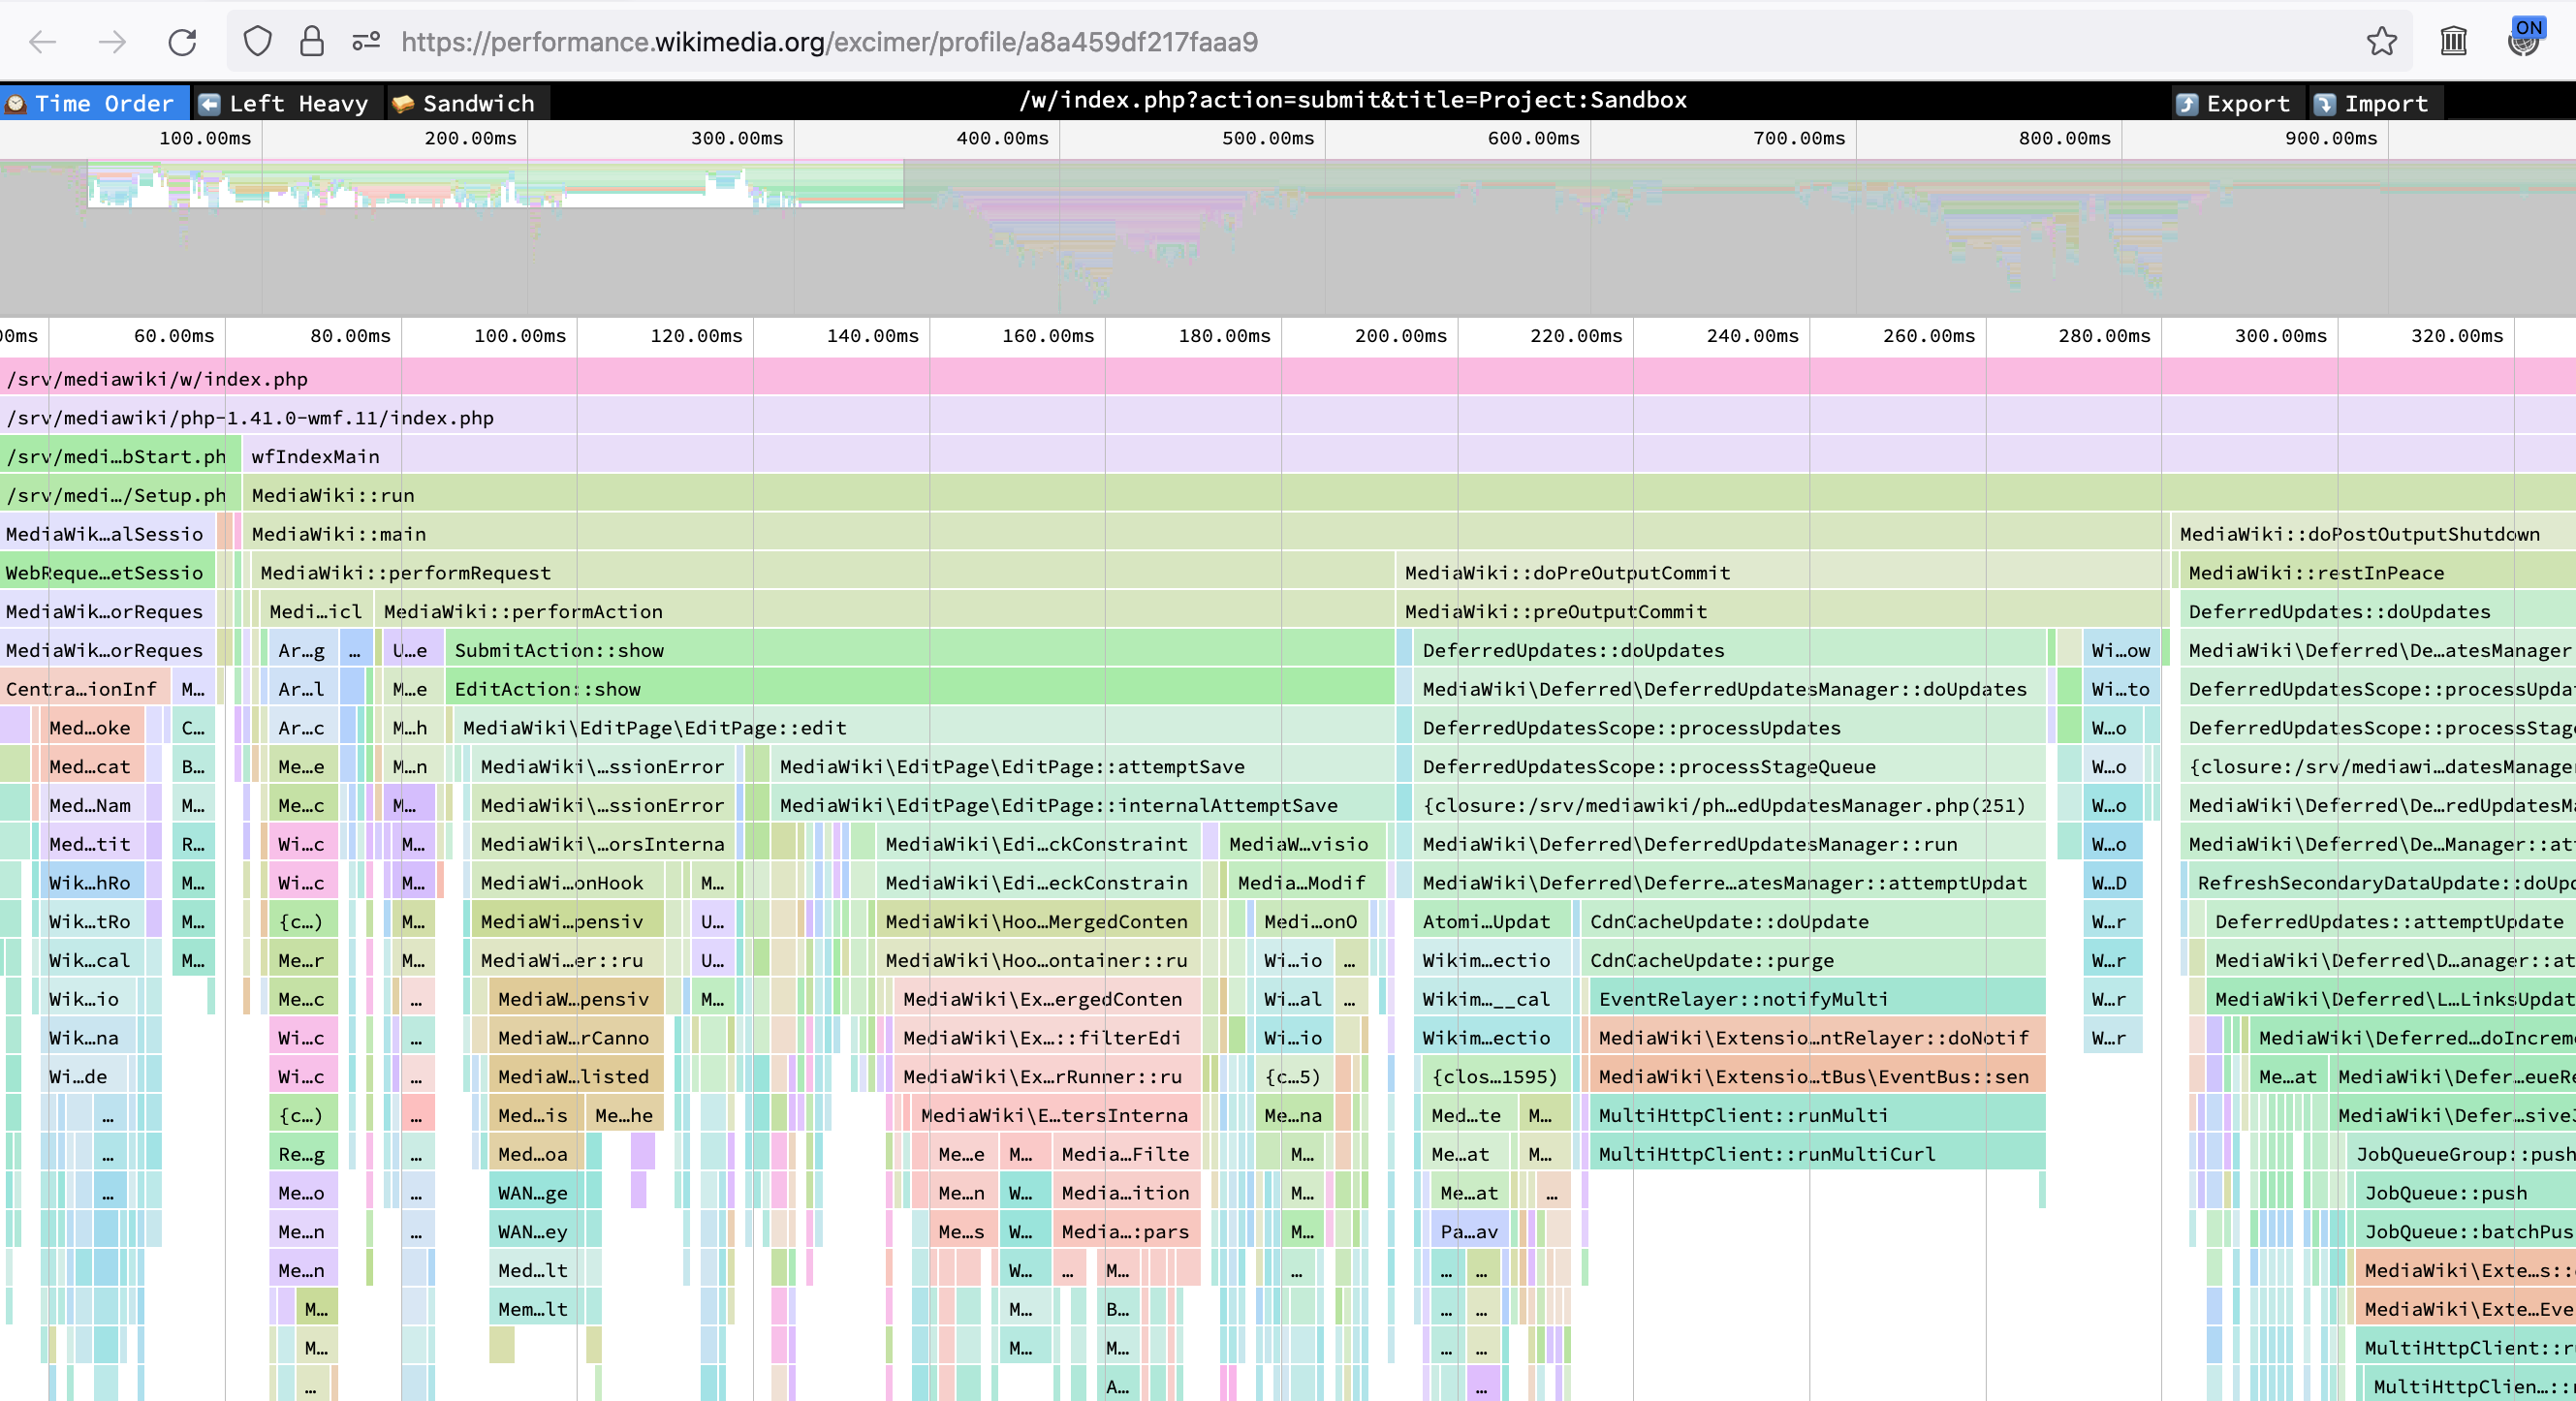
Example: In reviewing a change, which proposes adding caching somewhere, I was curious. Why is that function slow? I opened the feature and enabled WikimediaDebug. That brought me to an Excimer profile where you can search (ctrl-F) for the changed function (“doDomain”). We find exactly how much time is spent in that particular function. You can verify our results, or capture your own!

Tree diagram of function calls from top to bottom, each level sized by how long that function runs.
Flame graph in Excimer UI via Speedscope (by Jamie Wong, MIT License).

What: Production vs Debugging

We measure backend performance in two categories: production and debugging.

“Production” refers to live traffic from the world at large. We collect statistics from MediaWiki servers, like latency, CPU/memory, and errors. These stats are part of the observability strategy and measure service availability (“SLO”). To understand the relationship between availability and performance, let’s look at an example. Given a browser that timed out after 30 seconds, can you tell the difference between a response that will never arrive (it’s lost), and a response that could arrive if you keep waiting? From the outside, you can’t!

When setting expectations, you thus actually define both “what” and “when”. This makes performance and availability closely intertwined concepts. When a response is slower than expected, it counts toward the SLO error budget. We do deliver most “too slow” responses to their respective browser (better than a hard error!). But above a threshold, a safeguard stops the request mid-way, and responds with a timeout error instead. This protects us against misuse that would drain web server and database capacity for other clients.

These high-level service metrics can detect regressions after software deployments. To diagnose a server overload or other regression, developers analyze backend traffic to identify the affected route (pageview, editing, login, etc.). Then, developers can dig one level deeper to function-level profiling, to find which component is at fault. On popular routes (like pageviews), Arc Lamp can find the culprit. Arc Lamp publishes daily flame graphs with samples from MediaWiki production servers.

Production profiling is passive. It happens continuously in the background and represents the shared experience of the public. It answers: What routes are most popular? Where is server time generally spent, across all routes?

“Debug” profiling is active. It happens on-demand and focuses on an individual request—usually your own. You can analyze any route, even less popular ones, by reproducing the slow request. Or, after drafting a potential fix, you can use debugging tools to stage and verify your change before deploying it worldwide.

These “unpopular” routes are more common than you might think. Wikipedia is among the largest sites with ~8 million requests per minute. About half a million are pageviews. Yet, looking at our essential workflows, anything that isn’t a pageview has too few samples for real-time monitoring. Each minute we receive a few hundred edits. Other workflows are another order of magnitude below that. We can take all edits, reviews of edits (“patrolling”), discussion replies, account blocks, page protections, etc; and their combined rate would be within the error budget of one high-traffic service.

Excimer to the rescue

Tim Starling on our team realized that we could leverage Excimer as the engine for a debug profiler. Excimer is the production-grade PHP sampling profiler used by Arc Lamp today, and was specifically designed for flame graphs and timelines. Its data model represents the full callstack.

Remember that we use XHGui with Tideways, which favors accurate call counts by intercepting every function call in the PHP engine. That costly choice skews time. Excimer instead favors low-overhead, through a sampling interval on a separate thread. This creates more representative time measures.
Re-using Excimer felt obvious in retrospect, but when we first deployed the debug services in 2016, Excimer did not yet exist. As a proof of concept, we first created an Excimer recipe for local development.

How it works

After completing the proof of concept, we identified four requirements to make Excimer accessible on-demand:

  1. Capture the profiling information,
  2. Store the information,
  3. Visualize the profile in a way you can easily share or link to,
  4. Discover and control it from an interface.

We took the capturing logic as-is from the proof of concept, and bundled it in mediawiki-config. This builds on the WikimediaDebug component, with an added conditional for the “excimer” option.

To visualize the data we selected Speedscope, an interactive profile data visualization tool that creates flame graphs. We did consider Brendan Gregg’s original flamegraph.pl script, which we use in Arc Lamp. flamegraph.pl specializes in aggregate data, using percentages and sample counts. This is great for Arc Lamp’s daily summaries, but when debugging a single request we actually know how much time has passed. It would be more intuitive to developers if we presented the time measurements, instead of losing that information. Speedscope can display time.

We store each captured profile in a MySQL key-value table, hosted in the Foundation’s misc database cluster. The cluster is maintained by SRE Data Persistence, and also hosts the databases of Gerrit, Phabricator, Etherpad, and XHGui.

Freely licensed software

We use Speedscope as the flame graph visualizer. Speedscope is an open source project by Jamie Wong. As part of this project we upstreamed two improvements, including a change to bundle a font rather than calling on a third-party CDN. This aligns with our commitment to privacy and independence.

The underlying profile data is captured by Excimer, a low-overhead sampling profiler for PHP. We developed Excimer in 2018 for Arc Lamp. To make the most of Speedscope’s feature set, we added support for time units and added the Speedscope JSON format as a built-in output type for Excimer.

We added Excimer to the php.net registry and submitted it to major Linux package managers (Debian, Ubuntu, Sury, and Remi’s RPM). Special thanks to Kunal Mehta as Debian Developer and fellow Wikimedian who packaged Excimer for Debian Linux. These packages make Excimer accessible to MediaWiki contributors and their local development environment (e.g. MediaWiki-Docker).

Our presence in the Debian repository carries special meaning. Presence in the Debian repository signals trust, stability, and confidence in our software to the free software ecosystem. For example, we were pleased to learn that Sentry adopted Excimer to power their Sentry Profiling for PHP service!

Try it!

If you haven’t already, install WikimediaDebug in your Firefox or Chrome browser.

  1. Navigate to any article on Wikipedia.
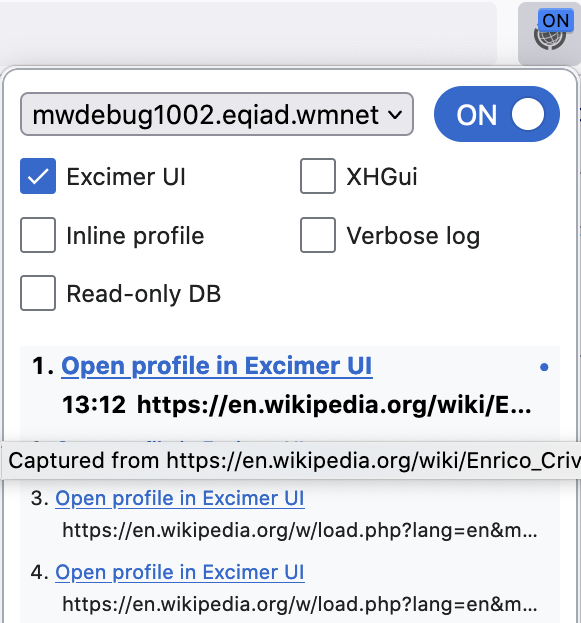
  2. Set the widget to On, with the “Excimer UI” checked.
  3. Reload the page.
  4. Click the “Open profile” link in the WikimediaDebug popup.

Accessible debugging tools empower you to act on your intuitions and curiosities, as part of a culture where you feel encouraged to do so. What we want to avoid is filtering these intuitions down to big incidents only, where you can justify hours of work, or depend on specialists.


Further reading:

Perf Matters at Wikipedia in 2016

Thumbor shadow-serving production traffic

Wikimedia Commons is our open media repository. Like Wikipedia and its other sister projects, Commons runs on the MediaWiki platform. Commons is home to millions of photos, documents, videos, and other multimedia files.

MediaWiki has a built-in imagescaler that, until now, we used in production as well. To improve security isolation, we started an effort in 2015 to develop support in MediaWiki for external media handling services. We choose Thumbor, an open-source thumbnail generation service, for Wikimedia’s thumbnailing needs.

During 2016 and 2017 we worked on Thumbor until it was feature complete and able to support the same open media formats and low-memory footprint as our MediaWiki setup. This included contributions to upstream Thumbor, and development of the wikimedia-thumbor plugin. We also fully packaged all dependencies for Debian Linux. Read more in The Journey to Thumbor (3-part series), or check the Wikitech docs

– Gilles Dubuc.


Exclude background tabs

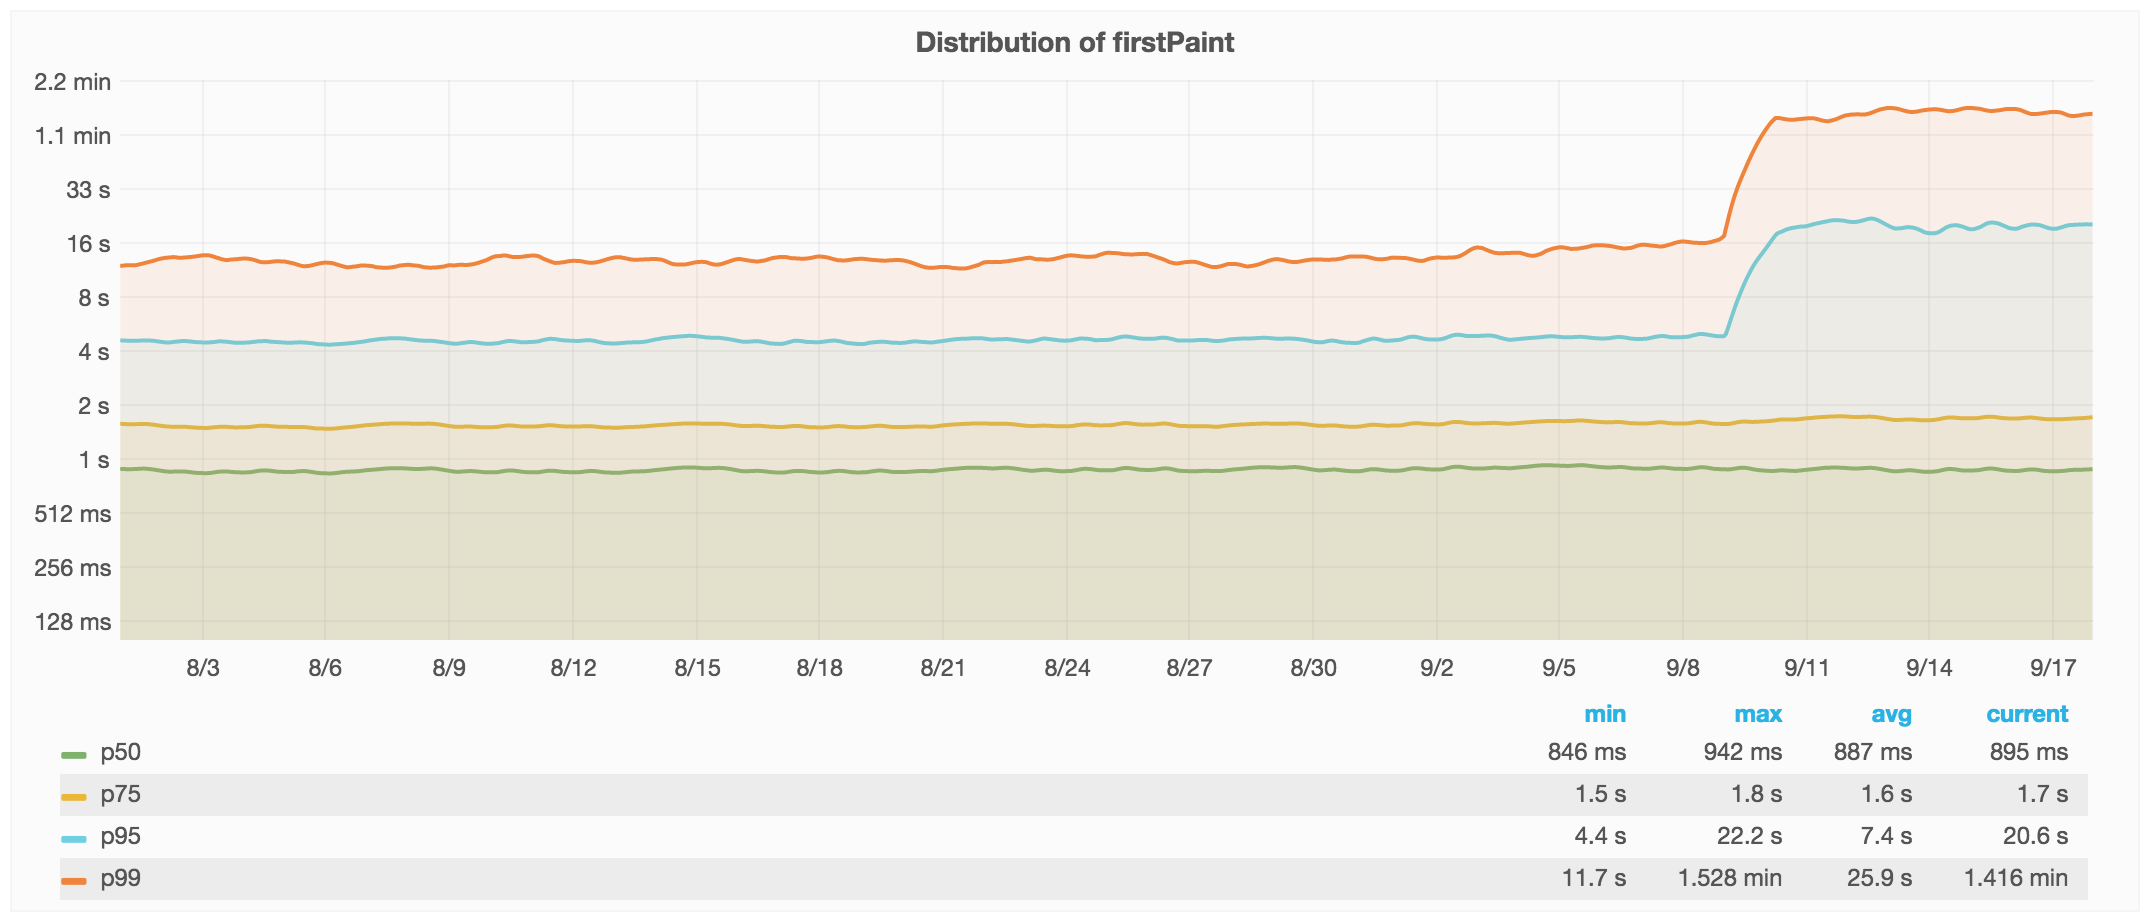
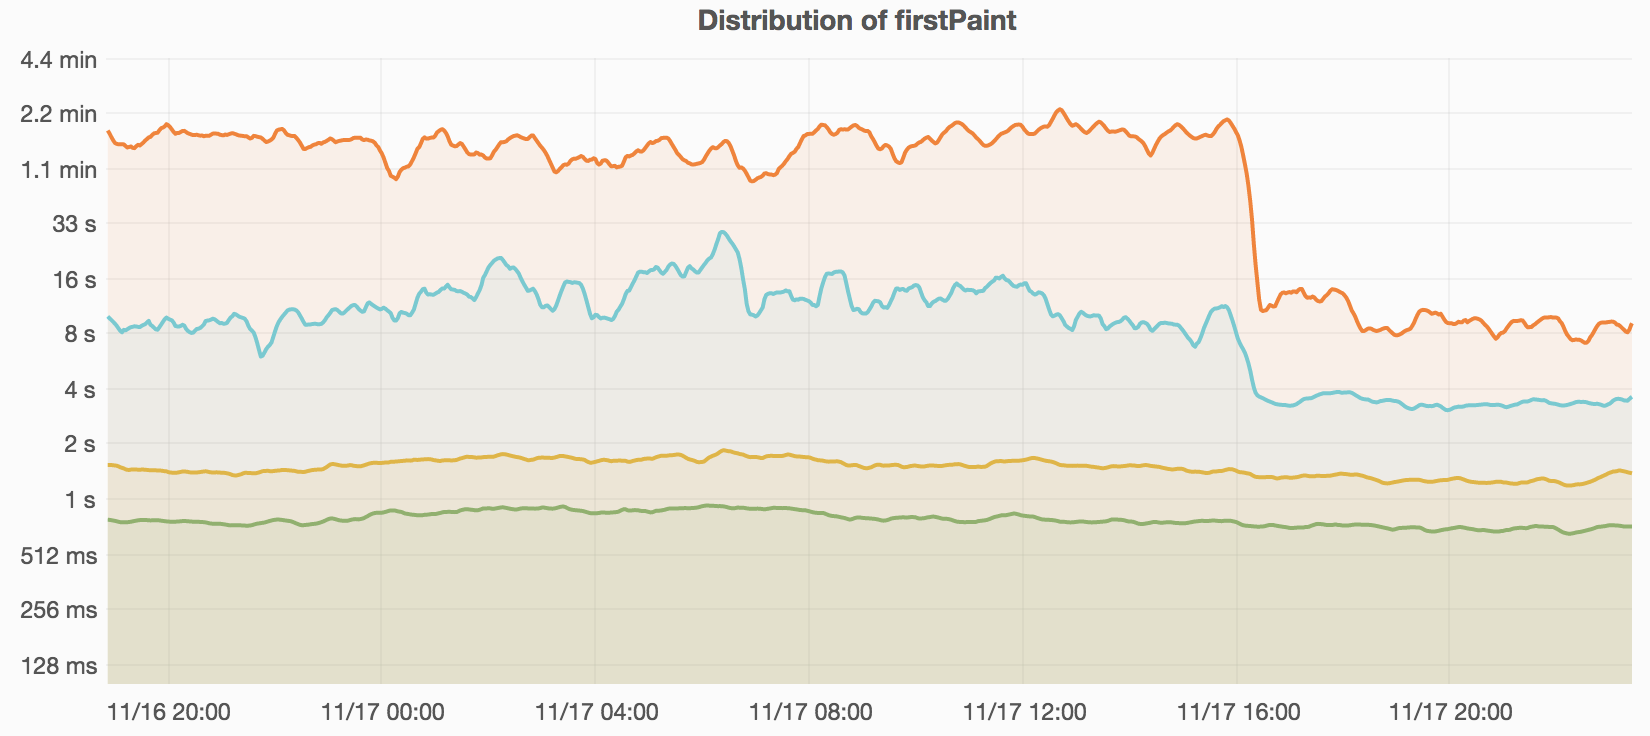
During routine post-deployment checks we found the p99 First Paint metric regressed from 4s to 20s. That’s quite a jump. The median and p75 during the same time period remained constant at their sub-second values.

A graph of the distribution of firstPaint
Distribution of First Paint, which prompted our investigation.

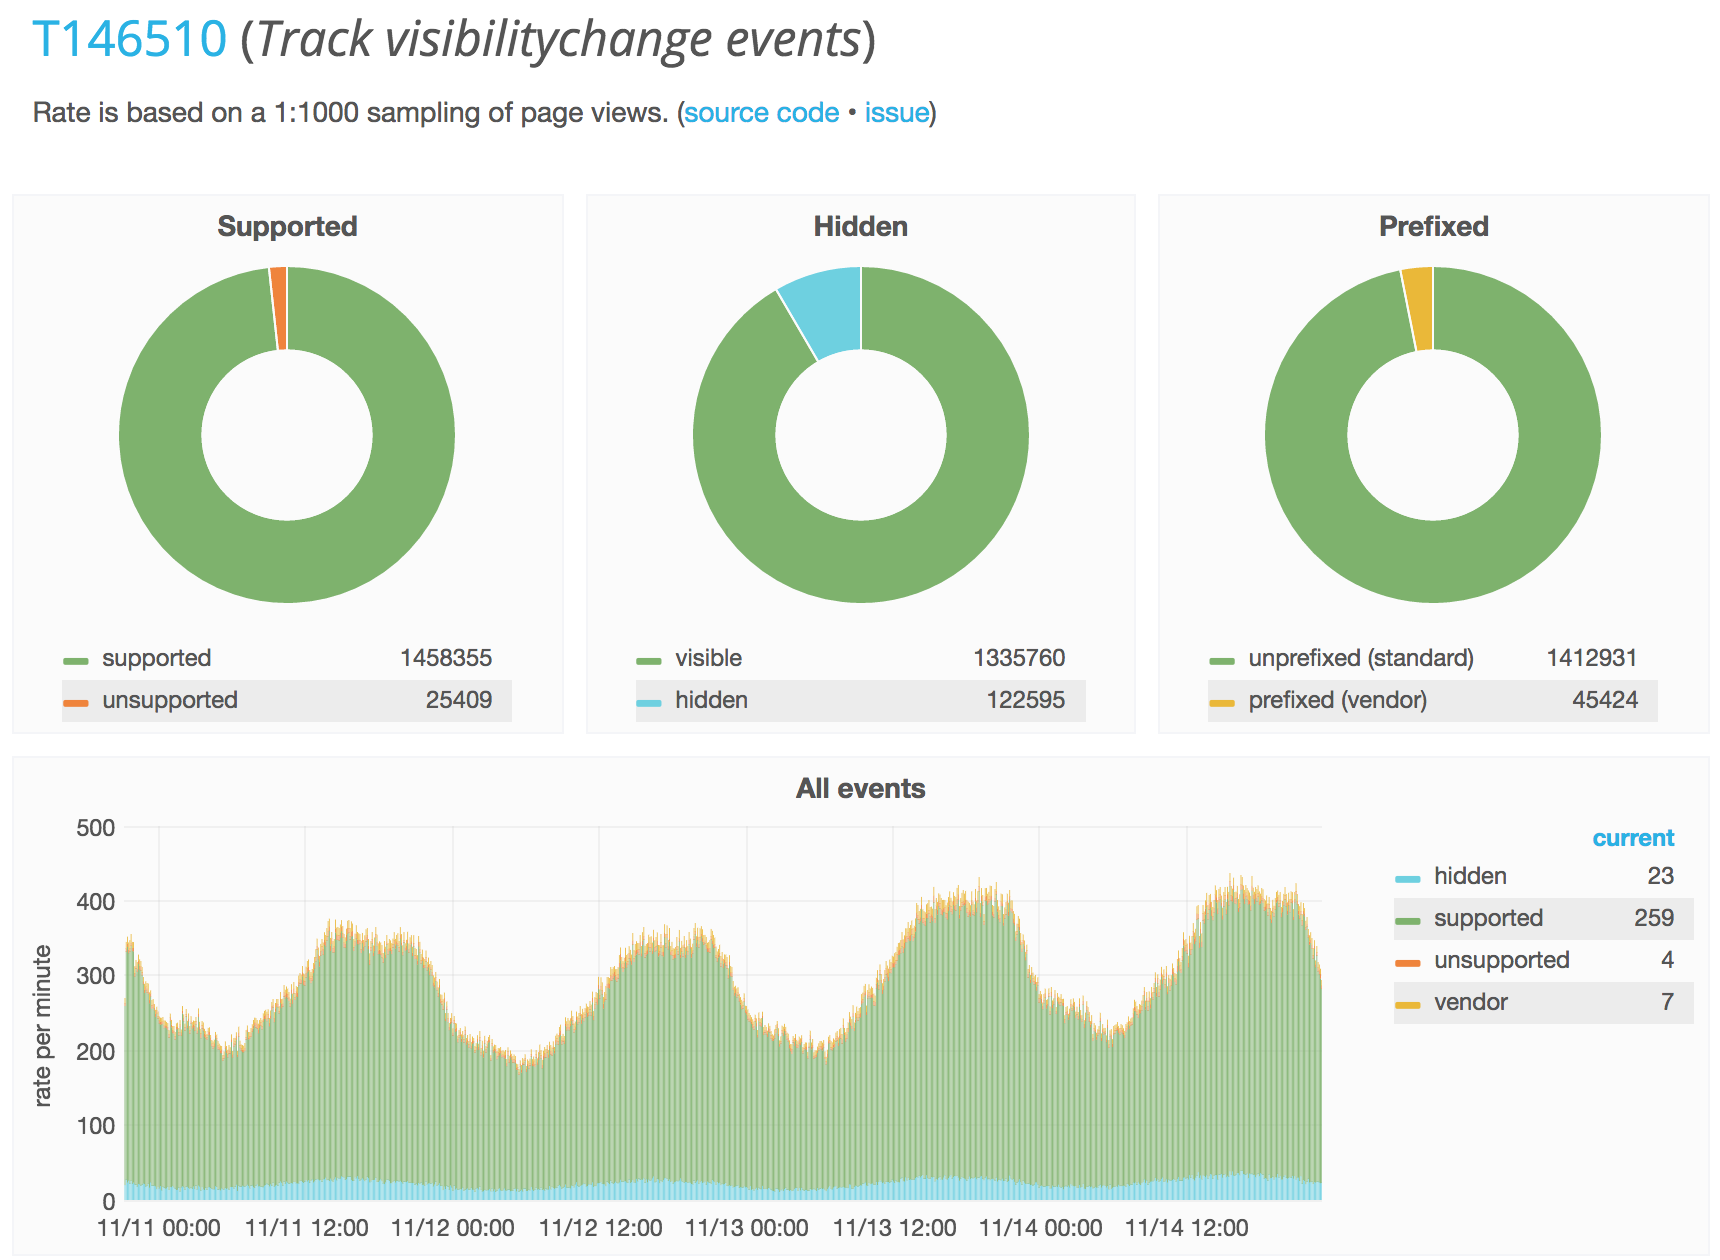
After an investigation we learned that page load time and visual rendering metrics are often skewed in visually hidden browser tabs (such as tabs that are open in the background). The deployment had refactored code such that background tabs could deprioritize more of the rendering work. Rather than revert this, we decided to change how MediaWiki’s Navigation Timing client collects these metrics. We now only sample pageviews in browser tabs that are “visible” from their birth until the page finishes loading.

To understand why background tabs had such an impact on our global metrics, we also ran a simple JS counter for a few days. We found that over a three-day period, 8.4% of page views in capable browsers were visually hidden for at least part of their load time. (Measured using the Page Visibility API, which itself was available on 98% of the sampled pageviews.)

Browser support and distribution of page visibility on Wikipedia.

– Peter Hedenskog and Timo Tijhof.


Performance Inspector goes Beta

We had an idea to improve page load time performance on Wikipedia by providing performance metrics to editors through an in-article modal link (T117411). By using the Performance Inspector, tech-savvy Wikipedians could use this extra data to inform edits that make the article load faster. At least, that was the idea.

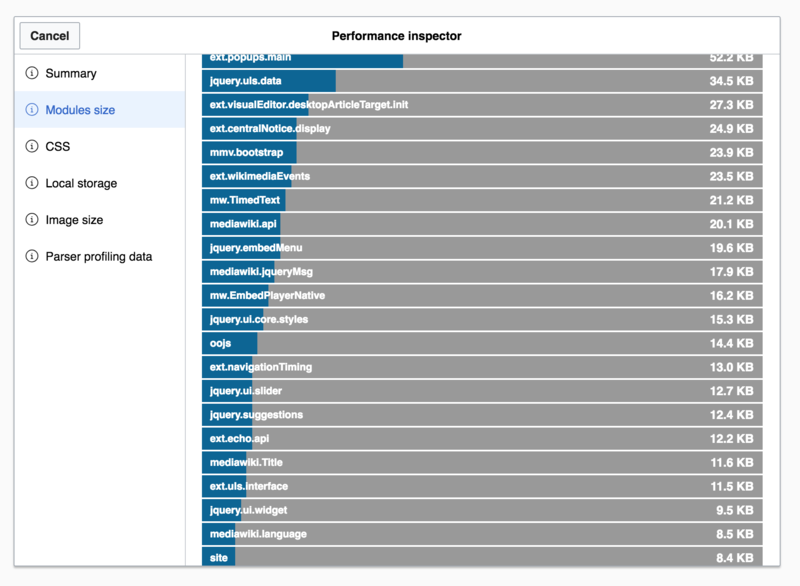
It turns out that in reality it’s hard for users to distinguish between costs due to the article content and costs of our own software features. It was hard for editors to actually do something that made a noticeable difference in page load time. We discontinued the Performance Inspector in favor of providing more developer-oriented tools.

— Peter Hedenskog.

The discontinued Perf Inspector offered a modal interface to list each bundle with its size in kilobytes.
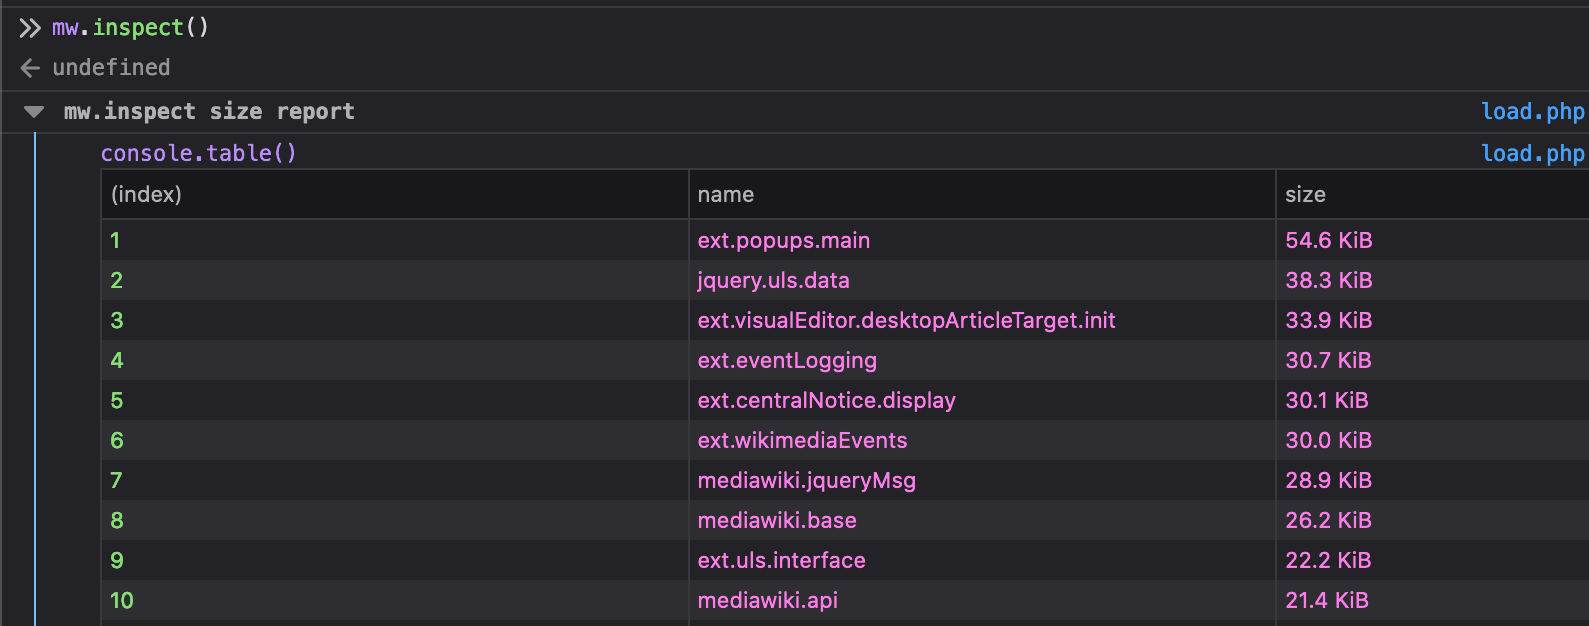
The “mw.inspect” console utility for calculating bundle sizes. 

Hello, HTTP/2!

Deploying HTTP/2 support to the Wikimedia CDN significantly changed how browsers negotiate and transfer data during the page load process. We anticipated a speed-up as part of the transition, and also identified specific opportunities to leverage HTTP/2 in our architecture for even faster page loads.

We also found unexpected regressions in page load performance during the HTTP/2 transition. In Chrome, pageviews using HTTP/2 initially had a slower Time to First Paint experience when compared to the previous HTTP/1 stack.  We wrote about this in HTTP/2 performance revisited.

– Timo Tijhof and Peter Hedenskog.


Stylesheet-aware dependency tracking

2016 saw a new state-tracking mechanism for stylesheets in ResourceLoader (Wikipedia’s JS/CSS delivery system). The HTML we send from MediaWiki to the browser, references a bundle of stylesheets. The server now also transmits a small metadata blob alongside that HTML, which provides the JS client with information about those stylesheets. On the client side, we utilize this new metadata to act as if those stylesheets were already imported by the client.

Why now

MediaWiki is built with semantic HTML and standardized CSS classes in both PHP-rendered and client-rendered elements alike. The server is responsible for loading the current skin stylesheets. We generally do not declare an explicit dependency from a JS feature to a specific skin stylesheet. This is by design, and allows us to separate concerns and give each skin control over how to style these elements.

The adoption of OOUI (our in-house UI framework that renders natively in both PHP and JavaScript), got to a point where an increasing number of features needed to load OOUI both as stylesheet for server-rendered elements, but also potentially load OOUI for (unrelated) JS functionality such as modal interactions elsewhere on the page. These JS-based interactions can happen on any page, including on pages that don’t embed OOUI elements server-side. Thus the OOUI module must include stylesheets in this bundle. This would have caused the stylesheet to sometimes download twice. We worked around this issue for OOUI, through a boolean signal from the server to the JS client (in the HTML head). The signal indicates whether OOUI styles were already referenced (change 267794).

Outcome

We turned our workaround into a small general-purpose mechanism built-in to ResourceLoader. It works transparently to developers, and is automatically applied to all stylesheets.

This enabled wider adoption of OOUI, and also applied the optimization to other reusable stylesheets in the wider MediaWiki ecosystem (such as for Gadgets). It also facilitates easy creation of multiple distinct OOUI bundles without developers having to manually track each with a boolean signal.

This tiny capability took only a few lines of code to implement, but brought huge bandwidth savings; both through relative improvements as well as through what we prevented from being incurred in the future.

Despite being small in code, we did plan for a multi-month migration (T92459). Over the years, some teams had begun to rely on a subtle bug in the old behavior. It was previously permitted to load a JavaScript bundle through a static stylesheet link. This wasn’t an intended feature of ResourceLoader, and would load only the stylesheet portion of the bundle. Their components would then load the same JS bundle a second time from the client-side, disregarding the fact that it downloaded CSS twice. We found that the reason some teams did this was to avoid a FOUC (first load the CSS for the server-rendered elements, then load the module in its entirety for client-side enhancements). In most cases, we mitigated this by splitting the module in question in two: a reusable stylesheet and a pure JS payload.

–  Timo Tijhof.


One step closer to Multi-DC

Prior to 2015, numerous MediaWiki extensions treated Memcache (erroneously) as a linearizable “black box”. A box that could be written to in a naive way. This approach, while somewhat intuitive, was based on dated and unrealistic assumptions:

  • That cache servers are always reachable for updates.
  • That transactions for database writes never fail, time out, or get rolled back later in the same request.
  • That database servers do not experience replication lag.
  • That there are no concurrent web requests also writing to the same database or cache in between our database reads.
  • That application and cache servers reside in a single data center region, with cache reads always reflecting prior writes.

The Flow extension, for example, made these assumptions and experienced anomalies even within our primary data center. The addition of multiple data centers would amplify these anomalies, reminding us to face the reality that these assumptions were not true.

Flow became among the first to adopt WANCache, a new developer-friendly interface we built for Memcached, specifically to offer high resiliency when operating at Wikipedia scale.

Replication lag was especially important. In MySQL/MariaDB, database reads can enjoy an “isolation level” that offers session consistency with repeatable reads. MediaWiki implements this by wrapping queries from a web request in one transaction. This means web requests will interact with one consistent and internally stable point-in-time state of the database. For example, this ensures foreign keys reliably resolve to related rows, even when queried later in the same request. However, it also means these queries perceive more replication lag.

WANCache is built using the “cache aside” and “purge” strategies. This means callers let go of the fine-grained control of (problematically) directly writing cache values. In exchange, they enjoy the simplicity of only declaring a cache key and a closure that computes the value. Optionally, they can send a “purge” notification to invalidate a cache key during a (soon-to-be-committed) database write.

Instead of proactively writing new values to both the database and the cache, WANCache lets subsequent HTTP requests fill the cache on-demand from a local DB replica. During the database write, we merely purge relevant cache keys. This avoids having to wait for, and incur load on, the primary DB during the critical path of wiki edits and other user actions. WANCache’s tombstone system prevents lagged data from getting (back) into a long-lived cache.

Read more about the Flow case study or Multi-DC MediaWiki.

– Aaron Schulz.


Improve database resilience

We made numerous improvements to database performance across the platform. This is often in collaboration with SRE and/or with the engineering teams that build atop our platform. We regularly review incident reports, flame graphs, and other metrics; and look for ways to address infra problems at the source, in higher-level components and MediaWiki service classes.

For example, the incident where a partial outage due to database unavailability, was caused by significant network saturation on the Wikimedia Commons database replicas. The saturation occurred due to the PdfHandler service fetching metadata from the database during every thumbnail transformation and every access to the PDF page count. This was mitigated by removing the need for metadata loads from the thumbnail handler, and refactoring the page count to utilize WANCache.

Another time we used our flame graphs to learn one of the top three queries came from WikiModule::preloadTitleInfo. This DB query uses batching to improve latency, and would traditionally be difficult to cache due to variable keys that each relate to part of a large dataset. We applied WANCache to WikiModule and used the “checkKeys” feature to facilitate easy cache invalidation of a large category of cache keys, through a single operation; without need for any propagation or tracking.

Read more about our flame graphs in Profiling PHP in production at scale.

– Aaron Schulz.


Further reading

About this post

Featured image credit: Long exposure of highway by PxHere, licensed under Creative Commons CC0 1.0.

❌